CHAPTER 5 LABORATORY STUDY TO SELECT THC DOSES
| Books - Influence of Marijuana on Driving |
Drug Abuse
CHAPTER 5 LABORATORY STUDY TO SELECT THC DOSES
5.1 Introduction
Doses used in all previous studies of inhaled THC have been selected without consulting the subjects beforehand to determine whether these realistically approximated doses they commonly use. In the opinion of several experts (Moskowitz, 1985; Chesher, 1986; Peck et al., 1986) this has resulted in the selection of maximum doses for experimental purposes that are considerably less than those used for recreational pursuits. One could arbitrarily select higher doses but with the risk of erring in the opposite direction. A dose of, say 300 Ag/kg, might be higher than any taken at one time by street users or, at any rate, higher than one they might take and then drive. If we were to select unrealistically high doses these could result in bizarre and potentially dangerous reactions in even the most controlled driving test. To avoid arbitrarily selecting the wrong maximum dose, it seemed necessary to consult the subjects in the context of a 'clinical' study.
The laboratory study's major purpose was therefore to establish the maximum dose for subsequent driving studies. Yet it provided several opportunities for obtaining valuable information about THC's pharmacokinetics and its pharmacodynamic effects after marijuana smoking. Blood samples were repeatedly taken for measuring [THc] and [THc-cooH]. The subjects repeatedly performed certain simple laboratory tests, estimated their levels of intoxication and indicated their willingness to drive under several specified conditions of urgency. In addition, heart rate was measured at these times. The secondary purpose was that of specifying relationships between [iHc] and [THc-cooli] with changes in the other physiological, performance or subjective variables.
5.2 Methods
Subjects
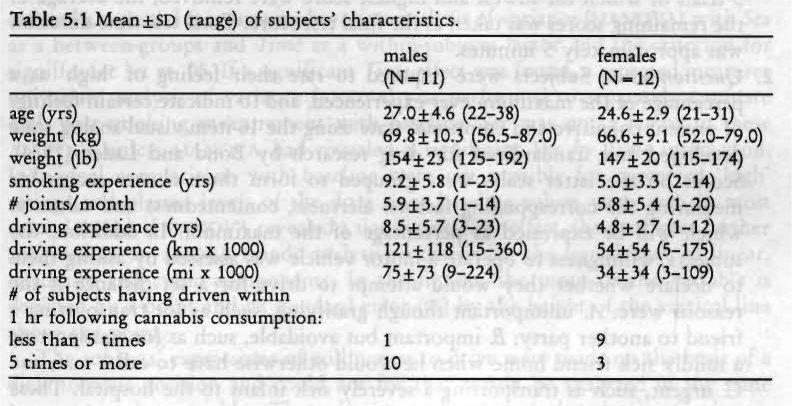
Twenty-four healthy volunteers, 12 males and 12 females, volunteered to participate in this study. They were screened as described in Chapter 4. Groups of six were treated and tested per night. Sessions were conducted in the evening between 19.00 and 24.00 hours and subjects smoked and were tested at staggered intervals of 10 minutes. GC/MS analysis of plasma obtained from one male revealed trivial amounts of values THC in the first and second samples after smoking but none thereafter, and no THC-COOH in any sample. It was concluded that this subject had not inhaled smoke so his data were excluded from further analyses. Characteristics of the remaining 23 subjects are given in Table 5.1. T-tests for independent samples showed that males were more experienced smokers than females (p < .044). Males' driving experience was nearly significantly greater than females' (p < .056 & .089 for number of years and km (mi), respectively).
Marijuana Cigarettes and Smoking Procedure
The marijuana cigarettes had an average weight of 767 mg and contained 2.57% or about 20 mg THC. The subjects were allowed to smoke part or all of the THC content in three cigarettes until achieving the desired psychological effect. Cigarettes were smoked ad lib through a plastic holder. The only requirement was to smoke continuously for a period not exceeding fifteen minutes. When subjects voluntarily stopped smoking, cigarettes were carefully extinguished and retained for subsequent gravimetric estimation of THC consumed.
Measurements
A test battery which lasted 20 minutes took place before smoking and was repeatedly administered at 30, 90, 150 and 210 minutes after initiation of smoking. The battery consisted of:
1. The Critical Tracking Test (ciT). This test, described in detail by Jex et al. (1966), was implemented on a IBM-compatible MS-DOS computer and measures the subject's ability to control a displayed error signal in a compensatory tracking task which increases in difficulty duringi a trial. Error appears as horizontal deviation of a cursor from midpoint on a horizontal, linear scale. Compensatory joy-stick movements null the error by returning the cursor to the midpoint. As the level of instability of the cursor increases during the trial, in direction and speed, the task becomes more difficult and eventually the subject is unable to compensate. The level of instability at which the subject loses control, called the critical frequency or k, is expressed in angular change of radius per second (rad/s). Theoretically, k is the reciprocal of the operating delay lag in human closed-loop manual control. The test included 5 trials of which the lowest and highest score were removed; the average of the remaining scores was taken as the final test score. Total test time duration was approximately 5 minutes.
2. Questionnaires. Subjects were required to rate their feeling of 'high' as a percentage of the maximum ever experienced, and to indicate certain feelings of present cognitive and emotional state using the 16-item visual-analog scale developed and standardized for drug research by Bond and Lader (1974). Scores on the latter scales were grouped to form three cluster scores for measuring the corresponding factors: alertness, contentedness and calmness which will be expressed as percentage of the maximum. In addition, the subjects' willingness to operate a motor vehicle was assessed by asking them to declare whether they would attempt to drive for a set distance if the reasons were: A. unimportant though gratifying, such as for transporting a friend to another party; B. important but avoidable, such as for transporting a mildly sick friend home when he would otherwise have to call a taxi; and C. urgent, such as transporting a severely sick infant to the hospital. These ratings were made by subjects immediately after termination of smoking and after conclusion of the CTT.
3. Heart Rate. Heart rate was measured manually by counting the number of beats per minute immediately after completion of the questionnaires.
4. Hand Steadiness Test. Thereafter, hand steadiness was measured from the number of side contacts occurring as the subject attempted to hold a 1 mm (0.04 in) stylus for 15 seconds within each of five circular holes with successively diminishing diameters (3.90, 3.05, 2.70, 2.20 and 1.85 mm, respectively; or, 0.154, 0.120, 0.106, 0.087 and 0.073 in). Subjects were allowed to rest their hand on the table. The test score was defined as the total number of contacts of the stylus with any side. Since the distribution of subjects' scores were skewed, a square root transformation was applied to normalize data. The test lasted about 3 minutes.
5. Blood Sampling. A blood sample was taken by means of a venepuncture ten minutes after the beginning of the test battery. The sample (2 aliquots containing 10 ml blood apiece) was heparinized and centrifuged, and plasma was placed in frozen (-20°C) storage prior to analysis for THC and its major metabolite THC-COOH. Blood samples were taken before and at 40, 100, 160 and 220 minutes after initiation smoking.
Subjects were familiarized with the questionnaires and practiced the CTT and hand steadiness test on three separate occasions during the weeks prior to the test night until they reached a steady performance level.
Data Analysis
Parametric data were analyzed as follows. All data including baseline values entered a repeated measures multivariate analysis of variance (mANovA) with Sex as a between-groups and Time as a within-subjects factor and the criterion for significance set at .05. If a significant Time effect was found, a repeated measures univariate analysis of variance (ANovA) was performed to separately compare each post-smoking measurement with baseline. Sex was not a factor in these ANOVA's unless MANOVA had revealed a significant Sex by Time interaction. Individual comparisons with baseline were not possible for perceived 'high' ratings and plasma levels of the drug since baseline values were zero in most cases. Instead, if MANOVA revealed a significant Time effect, the data were further analyzed in an ANOVA trends analysis to determine the significance of linear, quadratic and cubic components. In the figures, the mean of the variable is depicted by a point and its standard error (SE) by the height of the vertical line above the point.
The subjects' expressions of willingness to drive were made on the basis of a dichotomous decision and could not for that reason be analyzed in the same manner as other variables. These data were therefore analyzed using Cochran's Q-statistic to determine if the proportion of subjects willing to drive changed over time. If they did significantly, separate changes from baseline were tested by McNemar's sign-test.
Criterion for statistical significance in individual comparisons was adjusted by means of the 'Sequential Bonferroni' correction (Overall and Rhoades, 1987) to retain a constant type I error probability of .05 across the entire set of comparisons. This means that for the largest of four differences tested at once, p had to be less than .05/4=.013 to be judged significant. For the second, it had to be < .05/3= .017; for the third, <.05/2 = .025; and for the smallest difference, p < .05.
Significant Sex effects were generally absent. Results pertaining to differences between the sexes are therefore only reported for the exceptional cases where the differences were significant.
Two types of correlations were calculated to determine the linear relationship between two variables; i.e., the inter-subject and intra-subject correlation. The first is the most commonly used; it is obtained from pairs of variables measured in a group of subjects. In this study, for example, the correlation between [Thc] and X„ the tracking performance score, was calculated for all subjects at each sampling time separately. This resulted in four correlations (one at t=40, 100, 160 and 220 min) obtained from 23 subjects (N=23). These correlations were tested for significant departures from zero by t-test.
The intra-subject correlation, on the other hand, is the correlation between pairs of variables within one subject. In the present study, for example, the correlation between ['clic] and k was also calculated for each subject, across all sampling times, separately. This resulted in 23 correlations (one from each subject) obtained from four repeated measurements (N=4; baseline values were excluded). These were transformed into Fisher's z-scores and then averaged across subjects yielding z,„ which was tested for significant deviation from zero by t-test, and transformed back to r.
Interpretations of these two types of correlation are not the same. If, in the present study, a perfect inter-subject correlation (r= + 1.0) between [Thic] and k existed, it would mean that one can perfectly predict k of a particular subject from the knowledge of his/her [nic]. Usually, however, inter-subject correlations are much lower; and, the closer to zero, the more unreliable the predictions become.
A high average intra-subject correlation means that, on the average, scores on two variables are closely related within a subject, but not necessarily between subjects. Thus, a highly negative average intra-subject correlation between [THc] and k (lower scores indicating poorer performance) would mean that, within a subject, higher plasma levels of THC are associated with poorer tracking performance. Yet this does not imply that, if two subjects are compared, the one with the higher plasma levels performs worse. That would only be the case if both the average intrasubject and the intersubject correlations were strongly negative.
5.3 Results
Consumed 774C
Six subjects consumed one cigarette, thirteen smoked two and four smoked three. Total THC amounts consumed are given in Table 5.2. It should be noted that these amounts of THC represent both the amount inhaled and the portion that was lost through pyrolysis and side-stream smoke during the smoking process. Males consumed slightly more THC than females but the difference was not significant.
Subjects were next classified into two categories according to the frequency of reported cannabis consumption. Eleven subjects were infrequent users; i.e., between once weekly to once monthly; twelve subjects were classified as frequent users; i.e. at least once weekly but less than daily. Statistical analyses failed to reveal a significant difference between the two groups.

Plasma Concentrations of the Drug
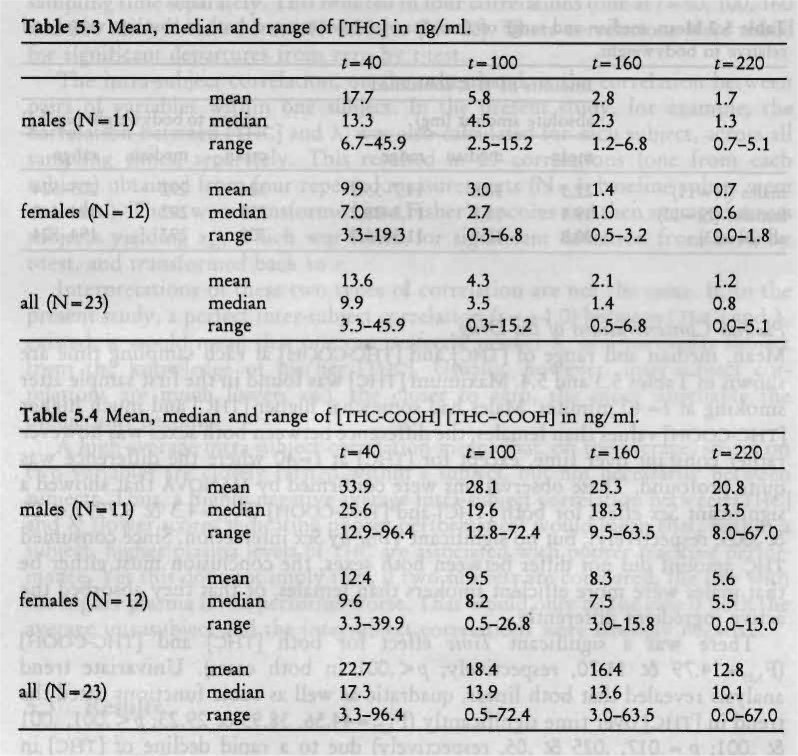
Mean, median and range of [THc] and [nic-cocm-i] at each sampling time are shown in Tables 5.3 and 5.4. Maximum [nic] was found in the first sample after smoking at t=40 minutes. Males had somewhat higher [Thic] and much higher [THc-cooH] values than females; the difference between both sexes was however rather constant over time, except for [THc] at t=40 where the difference was quite profound. These observations were confirmed by MANOVA that showed a significant Sex effect for both [nic] and [Thic-co0H] (F1.21=4.3 & 9.79; p< .05 & .005, respectively), but no significant Time by Sex interaction. Since consumed THC amount did not differ between both sexes, the conclusion must either be that males were more efficient smokers than females, or that they absorbed the active ingredient differently.
There was a significant Time effect for both [Thic] and [nic-cooli] (F3,19=14.79 & 11.70, respectively; p < .001 in both cases). Univariate trend analysis revealed that both linear, quadratic as well as cubic functions fitted the trend in [Tic] over time significantly (Fi,„ =44.56, 38.95 & 29.23; p< .001, .001 8c .001; p=.017, .025 & .05, respectively) due to a rapid decline of [ri-ic] in plasma after the first sample. THC-COOH changes over time were only significantly fitted by a linear trend (F,,,, = 26.92 p < .001; p, = .017).
The relation between consumed THC, relative to body weight, and [Thic] was examined by calculation of inter-subject correlations (intra-subject correlations could not be determined from the data because each subject smoked only one dose of THc). These analyses showed moderate inter-subject correlations between both parameters at each sampling time, namely 0.42 (p<.05), 0.34 (ns), 0.42
<.05) and 0.45 (p< .05). Yet inspection revealed that the apparent strength of these correlations was almost totally attributable to two males who had consumed the greatest amounts of THC (486 and 524 Ag/kg) and had also very high plasma levels of THC (45.9 and 35.5 ng/ml, respectively). Indeed, Spearman's rank correlations were small ( < 0.10) and not significant. There were no differences between males and females with respect to these correlations.
These results indicate that the between-subject variability in [Thic] is not related to the between-subject variability in the consumed amount of THC; in other words, information about [nic] and the time of blood sampling after smoking, of a particular individual, does not reveal how much that subject smoked, nor vice versa.
Perceived 'high'
Mean subjective ratings of 'high' are shown in Figure 5.1. The subjects consistently reported their peak subjective reaction as being about 70% of the greatest ever experienced. This was achieved shortly after smoking. Their subjective feelings declined, again in a highly consistent manner between subjects, until arriving at a level less than 15% of the greatest ever experienced, at a time 31/4 hours after smoking.
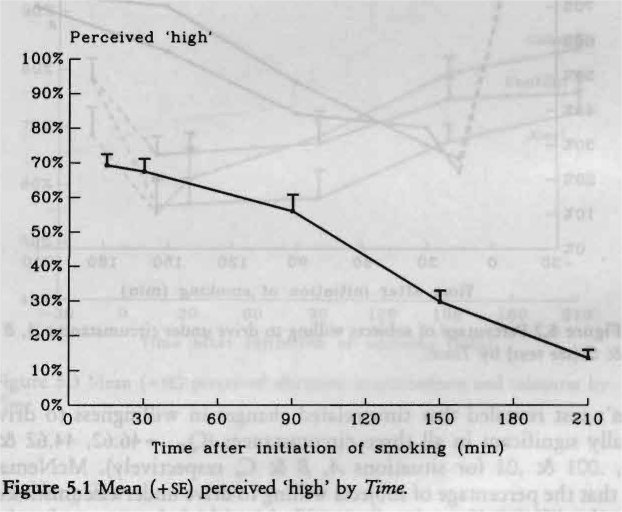
MANOVA revealed a significant Time effect (F4,18=49.18; p < .001). Trend analysis confirmed the impression from the data that the downward trend is best fitted by a linear function (F1,21=201.92; p< .001).
Willingness to Drive
Figure 5.2 displays percentages of the subjects that declared to be willing to drive under different circumstances of a gradually more compelling nature (A. unimportant though gratifying; B. important but avoidable; and, C. urgent). Only about 20% of the subjects declared their willingness to drive for relatively unimportant reasons (A and B), but approximately 80% declared that they would do so for an urgent reason (C), while experiencing the peak subjective reaction. Willingness to drive gradually rose to about 70% for unimportant reasons, and 100% for an urgent reason, by the end of the test session.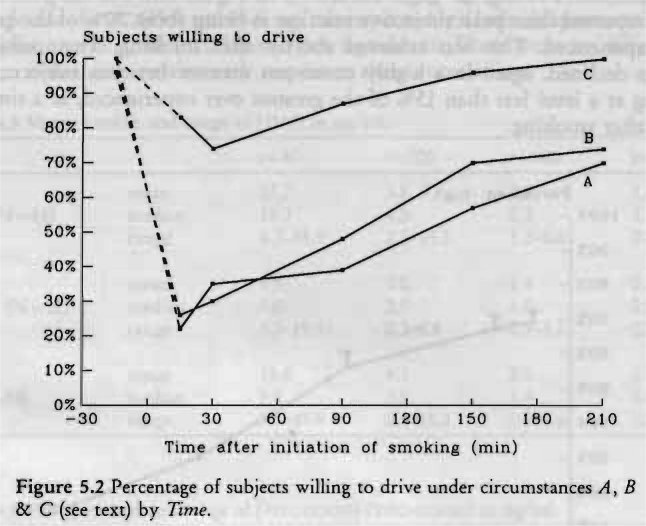
Cochran's test revealed that time-related changes in willingness to drive were statistically significant in all three circumstances (Qd(_5= 46.62, 44.62 & 15.17; p < .001, .001 & .01 for situations A, B & C, respectively). McNemar's test showed that the percentage of subjects willing to drive under circumstance A was significantly different from baseline until the end of the test session (p < .001, .001, .001, .002 & .02; p,= .01, .013, .017, .025 & .05), while under circumstance B changes were only significant until 21/2 hours after smoking (p< .001, .001 & .004; p,= .01, .013 & .017). McNemar's test failed to detect any significant change after smoking relative to baseline for circumstance C.
Perceived Alertness, Contentedness and Calmness
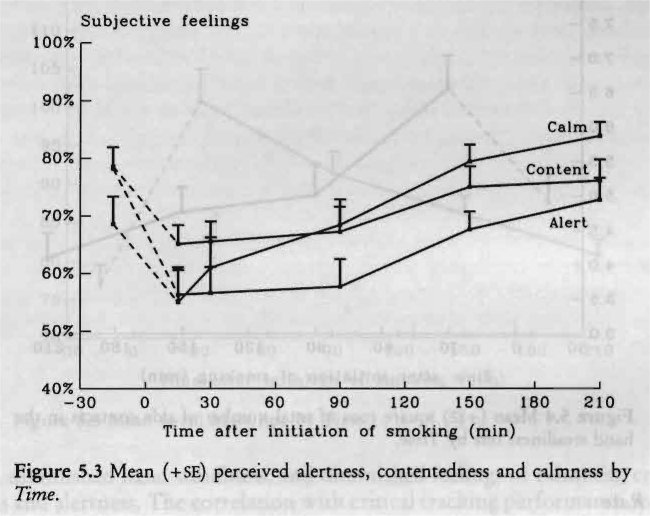
Figure 5.3 shows subjects' ratings of perceived alertness, contentedness and calmness. Scores on these factors changed significantly over time (F,,,,= 8.19, 5.79 & 7.02; p< .001, .003 & .001, respectively). Subjects felt significantly less alert relative to baseline until about 11/2 hours after smoking (F1,22=34.67, 20.03 & 16.97; all p < .001; p=.01, .013 & .017). Separate sequential comparisons of subjective feelings of contentedness provided the same results (F1,22=27.24, 19.98 & 9.99; p< .001, .001 & .004; p,= .01, .013 & .017). Feelings of calmness followed a different profile over time. Separate sequential comparisons showed that no significant change occurred during the first few hours after smoking, but at the end of the session subjects felt calmer than they had at baseline (F,,,,= 12.25; p < .002; pc= .01).
Critical Tracking Test
The average frequency at which the subjects lost control (X) was 4.40 rad/s before smoking and fell to 4.15 rad/s in the first test after smoking and gradually rose to baseline level in later tests. MANOVA however failed to show a significant Time effect.
Hand Steadiness Test
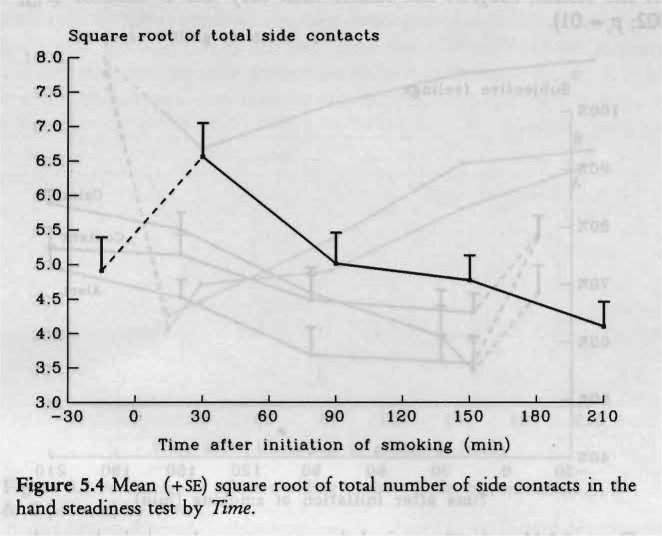
Figure 5.4 demonstrates that subjects' hand steadiness diminished after smoking marijuana, but this effect dissipated rapidly after the first test. On the average, the subjects' hand steadiness was even superior at a time two hours after smoking to what it had been initially.
MANOVA revealed a significant Time effect (F4,18=6.38; p< .002). Yet separate comparisons showed that hand steadiness was only significantly different from baseline in the first test after smoking (Fix =16.89; p < .001; pc = .013).
Heart Rate
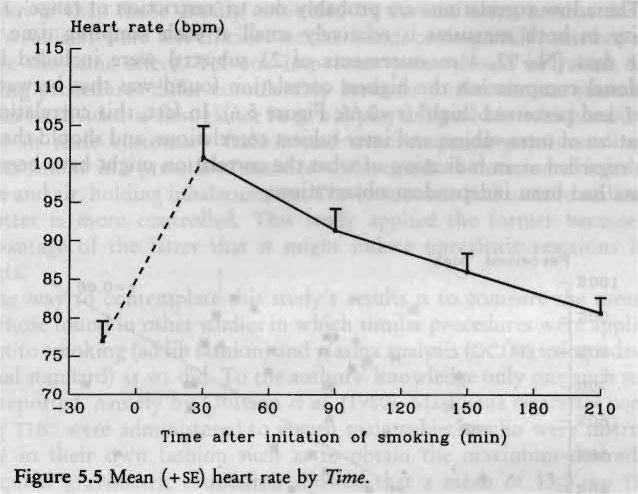
The subjects' average heart rate, presented in Figure 5.5, varied between 75 and 100 beats per minute (bpm) in close accordance with their subjective feelings. Thirty minutes after smoking, the increase in heart rate varied from 2 to 77 bpm, with a mean elevation of 24 bpm. Heart rate diminished over successive measurements approaching baseline values after 31/4 hours. MANOVA revealed a significant Time effect (F,,,, = 10.43; p < .001) and separate ANOVA comparisons showed that these elevations were significantly different from baseline at each but the last measurement (F,,„ = 35.64, 21.90, 12.67 & 2.37; p < .001, .001, .002 & .14; pc = .013, .017, .025 & .05, respectively).
Intra-Subject Relations between Variables
Table 5.5 shows the average intra-subject correlations between [THc], log,0[THc], and [Thic-cooH] with each of the other variables. The log transformation was applied to achieve a more linear and homeoscadastic relationship between THC values and the other variables. The constant of 1 was added to the raw [THc] values for avoiding negative log transformations. It can be concluded from this table that, within subjects, higher plasma levels of the drug were associated with, and probably produced, increased heart rate, increased feelings of perceived 'high', diminished hand steadiness, and diminished feelings of calmness, contentedness and alertness. The correlation with critical tracking performance was not significant, confirming the insensitivity of the test. The log transformation of [Tic] did not change the size of the correlations dramatically.
Inter-Subject Relations between Variables
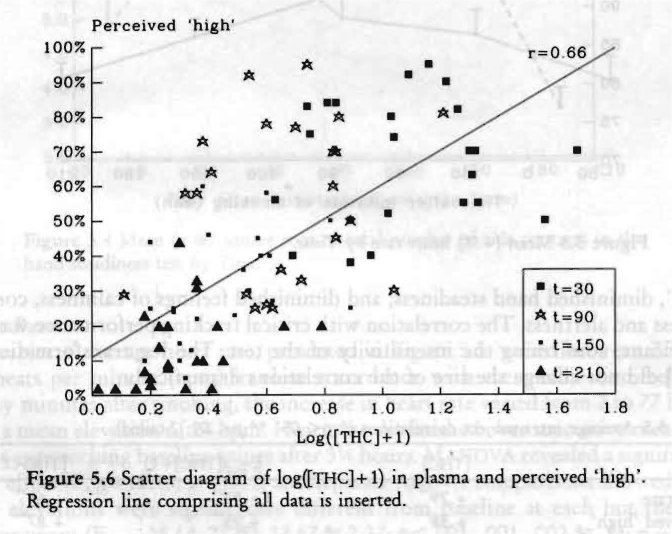
Inter-subject correlations between plasma concentrations of the drug and measures of subjective feelings, heart rate and performance were typically low (r < .50) at each sampling time. The correlations between log [Tfic]-1- 1 and perceived 'high', for example, were r=0.07 (ns), 0.19 (ns), 0.43 (p<.05) and 0.35 (ns), at t=40, 100, 160 and 220 minutes after initiation of smoking, respectively. These low correlations are probably due to 'restriction of range', i.e. the variability in both measures is relatively small at each sampling time. If all available data (N=92, 4 measurements of 23 subjects) were included in the correlational computation the highest correlation found was that between log [THc]+ 1 and perceived 'high' (r=0.66; Figure 5.6). In fact, this correlation is a combination of intra-subject and inter-subject correlations, and should therefore only be regarded as an indication of what the correlation might have been if all these data had been independent observations.
5.4 Discussion
The laboratory study's major purpose was to determine the amount of THC recreational users of cannabis smoke to reach a comfortable 'high' and to establish from these results the maximum dose for subsequent driving studies. Median and mean amount of THC consumed were 308 and 292 pg/kg respectively. From these results it was decided that the maximum dose for subsequent driving studies would be 300 gig/kg. This is considerably higher than doses that have usually been administered to subjects in experimental studies (typical, 100-200 pg/kg THc). This could mean either that previous studies' THC doses were lower than those usually consumed by current users, or that the present study's subjects were less efficient smokers and, consequently, smoked more to achieve the same effect. Yet one important point should be raised. Imposed smoking procedures differ considerably between studies on marijuana's effects and can be divided at first glance in two types, self-paced in which subjects may smoke in their customary fashion and machine-paced procedures in which subjects smoke in a prescribed manner with regards to duration of inhalation of smoke and air, holding inhalation, etc. The former method is more realistic while the latter is more controlled. This study applied the former because of the disadvantage of the latter that it might induce unrealistic reactions in some subjects.
One way to contemplate this study's results is to compare the mean [Thc] with those found in other studies in which similar procedures were applied with respect to smoking (ad lib fashion) and plasma analysis (Gc/ms using a deuterated internal standard) as we did. To the authors' knowledge only one such study has been reported, namely by Ohlsson et al. (1980). Marijuana cigarettes containing 19 mg THC were administered to eleven male subjects who were instructed to smoke in their own fashion such as to obtain the maximum desired 'high'. Subsequent gravimetric estimation showed that a mean of 13.0 mg TI-IC was consumed. [TI-ic] values ranged between 5.4 and 18.0 (mean 12.4) ng/ml 30 minutes after termination of smoking. Only the males of the present study should be included in the comparison with Ohlsson's study, because of the significant difference found between [nic] values of both sexes in the current study. Eleven males in the present study smoked 22.3 mg Ti-IC, on average, and their plasma concentrations ranged between 6.7 and 45.9 (mean 17.7) ng/ml 40 minutes after initiation of smoking. Thus, our subjects smoked 70% more TH( than Ohlsson's subjects did, resulting in a 43% higher mu level in plasma, as measured 30 minutes after smoking. The average [THc] found in the present study was therefore in the expected direction. This observation may lead to the tentative conclusion that the preferred 'I'HC dose to reach a desired 'high' in the present study was not due to inefficient smoking but to the fact that current marijuana (or hashish) users do smoke higher THC doses than previously administered in scientific studies.
Other results from the present study showed that perceived 'high' and heart rate are very sensitive (psychological and physiological) measures of marijuana intoxication which confirms prior research. Impairments in laboratory tests performance were measured at the time of peak subjective feelings but generally, objective impairment dissipated more rapidly than the feelings themselves. All objective signs of impaired functions were gone within 1.5 hours after smoking. The explanation may be that practice and habituation effects, or both, occurred during the session concealing marijuana's impairment, or, that procedural errors have been made in administering these tests. No definitive answer can be provided and no conclusions can be drawn from this study with respect to marijuana's effects upon performance because of the lack of a control group. The study was simply not designed to estimate these effects, only to indicate whether either of these measures should be considered for inclusion in later studies. If any measure appeared to be systematically related to the inferred changes in THC's pharmacological activity over time, this measure might assume a high degree of practical importance. Correlational analyses, however, showed no strong relationships between [THc] or [THc-cooH] and performance in any test.
An important issue relating to traffic safety is whether subjects would drive a car while under the influence of marijuana. Although all subjects had admitted driving a car while intoxicated at least once before, a majority (about 65%) of the subjects was not willing to drive a car for relatively unimportant reasons shortly after smoking when experiencing the drug's peak subjective reaction. However, most said they would drive, for a very urgent reason. On one hand, this means that the majority of the subjects are aware of a potential marijuana related driving impairment; on the other, a sizable minority (35%) would not refrain from driving a car for unimportant reasons when they are experiencing a 'high'. These subjects in particular are a source of concern with respect to traffic safety, if marijuana smoking indeed impairs driving performance. Two questions that arise from these contemplations were addressed by the succeeding driving studies; namely, I. does marijuana adversely affect driving performance, and 2. is willingness to drive after marijuana smoking related to driving impairment?
| < Prev | Next > |
|---|


