CHAPTER 7 MARIJUANA AND DRIVING ON A NORMAL HIGHWAY IN TRAFFIC
| Books - Influence of Marijuana on Driving |
Drug Abuse
CHAPTER 7 MARIJUANA AND DRIVING ON A NORMAL HIGHWAY IN TRAFFIC
7.1 Introduction
The preceding study showed that the average driving impairment on a closed highway segment was never particularly great after doses of 100, 200 and 300 Ag/kg THC (equivalent to impairment at 0.05 to 0.07 g% BAc) making it ethically acceptable to test the same doses' effects on performance in a more natural environment. It seemed essential to do so because the extent to which one can generalize from closed-course testing to the real world is presently unknown. Therefore, the same approach was applied for testing THC's effects on driving performance in a more realistic situation. In particular, the same THc doses were administered to a new group of subjects undertaking similar driving tests, though now on a highway in the presence of other traffic.
The present study was only the second wherein subjects drove in real traffic after receiving THC treatments. It was the first in which subjects inhaled higher 'street doses' of THC before driving. Though the preceding study on a closed highway failed to show dramatic effects of high THC doses on high-speed driving, a conservative approach was chosen in designing the present study in order to satisfy the strictest safety requirements. This approach is unique in traffic science but closely follows the procedure used to determine the tolerability of medicinal drugs in human pharmacological research. It is to test THC's effects on actual driving performance in an ascending dose series (below). If any subject would have reacted in an unacceptable manner to a lower dose, he/she would not have been permitted to receive a higher dose.
The major objective of this study was to confirm the relationship between inhaled THC dose and lateral position variability in the context of a standard road tracking test. A secondary objective was to measure performance in another actual driving test (i.e. car following) to determine whether degrees of impairment would correlate between the two tests in a manner indicating a general influence of THC on driving behavior. The third objective was to continue efforts to correlate plasma concentrations of THC and THC-COOH with driving performance impairment as measured in both tests.
7.2 Methods
Subjects
Sixteen new subjects, equally comprised of men and women, were selected according to the same inclusion/exclusion criteria as before. They were individually trained to perform the driving tests in a preliminary 'dress rehearsal'. Training at laboratory tests continued until each subject achieved satisfactory, asymptotical performance levels.
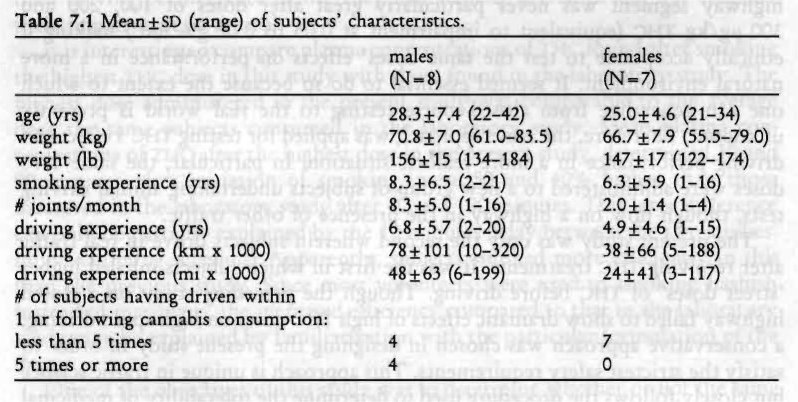
Plasma analyses after conclusion of the study showed that one female's plasma contained neither THC nor THC-COOH in any sample. It was concluded that this subject had not inhaled smoke, so her data were excluded from further analyses. Characteristics of the remaining 15 subjects are given in Table 7.1. T-tests for independent samples showed that males were heavier smokes than females (p< .007). There were no other significant differences between the sexes.
Design, Doses and Administration
The study was conducted according to an ascending dose series design where both active drug and placebo conditions were administered, double-blind, at each of three THC dose levels. THC doses were the same as those used in the previous study, namely 100, 200 and 300 Ag/kg.
The lowest dose and placebo were administered in separate First Level treatment conditions spaced a week apart. Half the group received these treatments in the same order, the others in reverse order. Subjects proceeded to the next dose only if, in the driving instructor's opinion, no severe and potentially unsafe drug effects had occurred; and, if the subject was willing to go on to the next level. The intermediate dose and placebo were administered the same way
in the Second Level conditions and the decision to proceed was made on the same grounds. The highest dose and placebo were administered the same way in the Third Level conditions to conclude the study.
Marijuana cigarettes were prepared from batches containing 1.77% THC for the lowest, 2.64% THC for the intermediate, and 3.58% THC for the highest dose. Cigarettes appeared identical at each level of treatment conditions. Subjects smoked the cigarettes through a plastic holder, ad lib, but they were encouraged to smoke the entire dose in ten minutes. After cessation of smoking, cigarettes were retained for subsequent gravimetric estimation of THC consumed. These analyses revealed that the average (± SD) amount of consumed THC in the three marijuana conditions was 6.9 (± 0.7), 13.8 (+ 1.4) and 20.7 (±2.2) mg, or 100 (+4), 204 (±7) and 299 (±7) Ag/kg, respectively.
Testing Procedures
Upon arrival at the laboratory, subjects' breath and urine were tested for the presence of alcohol and cannabinoids. If cannabinoids were found in the urine, a blood sample was taken for later verification of the presence of THC. Two subjects at a time commenced smoking at t=0 (Table 7.2).
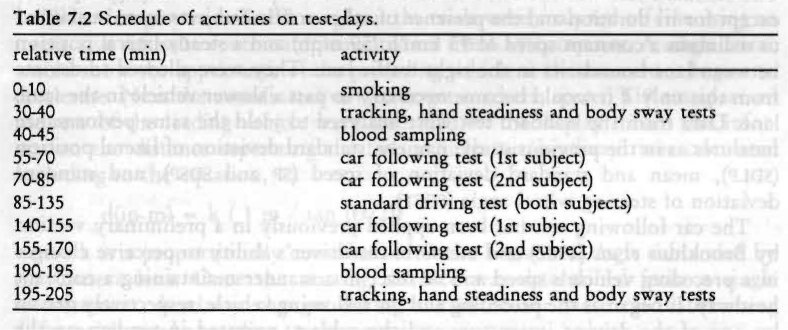
Thirty minutes after onset of smoking the subjects performed a battery of laboratory tests (tracking, hand steadiness and body sway) and yielded a blood sample. They were then transported to a primary highway (A76, different than in the previous study) between the Dutch cities of Maastricht and Heerlen where the driving tests were performed. Two instrumented vehicles, the same as those in the previous study, were employed in this study. One subject started the car following test (below) in the eastward direction whilst the other subject was sitting in the passenger's seat of the preceding car involved in the same test. The test was conducted on a 16 km (9.9 mi) circuit of the highway and lasted about twelve minutes. At the end of the circuit the car turned at a signalized intersection and parked at a service station, whereupon the subjects reversed roles to repeat the test running in the opposite direction. The new driver reentered the highway and began his/her car following test. After conclusion of the car following test, the subject left the highway at an exit ramp and reentered in the opposite direction on the associated entrance ramp. Thereupon both vehicles parked on the paved shoulder.
Both subjects then commenced the standard driving test (below) in separate instrumented vehicles at t=85 and t=88, respectively. The test circuit was the same as for the car following test. Subjects drove twice around the circuit (in total, 64 km or 40 mi) without stopping in about 50 minutes. At the conclusion of this test, both subjects participated again in the car following test in the same order as before. Subjects were then transported back to the laboratory where they yielded a blood sample and repeated the test battery.
Two pairs of subjects were tested per test night. One pair performed the driving test in daylight, i.e. between 19.30 and 21.30 hours; the other pair commenced driving at 21.30 hours and finished at 23.30 hours in darkness.
Driving Tests
The standard test was the same as described in the previous study (Chapter 6) except for its duration and the presence of other traffic. Subjects were instructed to maintain a constant speed of 95 km/h (59 mph) and a steady lateral position between lane boundaries in the right traffic lane. They were allowed to deviate from this only if it would become necessary to pass a slower vehicle in the same lane. Data from the standard test were analyzed to yield the same performance measures as in the previous study; namely, standard deviation of lateral position (sDLP), mean and standard deviation of speed (sP and spsP), and standard deviation of steering wheel angle (sDsT).
The car following test has been applied previously in a preliminary version by Brookhuis et al. (1987) and measures the driver's ability to perceive changes in a preceding vehicle's speed and to react in a manner maintaining a constant headway. It began as the preceding and the following vehicle, respectively driven by one of the driving instructors and the subject, operated in tandem on the slower traffic lane while travelling at a speed of 100 km/h (62 mph). The subject was instructed to maintain a 50 m (164 ft) headway however the preceding vehicle's speed might vary. After driving in this manner for about one minute, the operator of the preceding vehicle released the accelerator pedal allowing its speed to fall to 80 km/h (50 mph). Immediately thereafter, the operator of the preceding vehicle accelerated to 100 km/h (62 mph). The duration of one deceleration and acceleration maneuver was approximately 50 seconds and six to eight, depending upon traffic density, were executed during one test.
The velocity of the leading vehicle was transmitted via telemetry to a receiver in the following vehicle. This signal, along with the following vehicle's own velocity were recorded in parallel, time-coded files on computer files. These data entered a power spectral analysis for yielding phase-delay, modulus or gain and coherence between the vehicle's velocities at the maneuver cycle frequency (i.e. 1/50 s=0.02 Hz). The average phase-delay between frequencies of 0.01 and 0.03 Hz, encompassing the frequency of the deceleration and acceleration maneuvers, was then calculated and transformed to the time domain to yield a measure of the subject's average reaction time to the movements of the leading vehicle (RI, in seconds). This was taken as the primary dependent variable from the car following test. Gain and coherence were recorded for control purposes. lithe test was performed according to instructions, gain should have a value of about 1.0, and coherence, > .90.
During the trials, 3 to 6 direct measurements of separation distance between the following and leading vehicle were made by means of a S-VHS video recording system which was mounted between the following vehicle's front seats facing forward through the windshield. Images of the rear of the preceding vehicle were acquired prior to each deceleration/acceleration maneuver. The camera's internal clock signal was recorded with the video imagery and also converted in an electronic pulse code for simultaneously computer recording along with the two vehicles' speed.
Video imagery recorded throughout the trials were analyzed off-line using an interactive software routine implemented on a IBM-AT computer. A single frame would show the appearance of the preceding vehicle at the moment it begins to decelerate. Next the coordinates of two target markers, spaced 119 cm apart on the rear of the leading vehicle were identified on the display. From this information the distance separating the two vehicles or 'headway' was calculated according to the equation,
d(in m) = k ( 1 m / tan (0/2))
where k is a proportionally constant and 0 the horizontal angle subtended by the camera lens. Once the starting distance was determined from a single measurement, headway changes during the maneuver were calculated using differential speed according to the equation,
H (t) = I Vp dt - f Vf dt + H,
where headway varies as a function of time (t) according to the difference between integrals of velocities of preceding and following vehicles (Vp,Vf) plus the headway (1-10) that existed at the beginning of the maneuver. Headway and coefficient of variation (cv) of headway during maneuvers were taken as secondary dependent variables. The coefficient of variation of headway, and not standard deviation, is preferable because of the latter's confounding by mean headway.
Questionnaires
The same subjective questionnaires used in the previous study were administered to the subjects in the present study. Subjective feelings of 'high', present cognitive and emotional state, and subjects' willingness to drive were assessed before the onset and after the conclusion of the driving tests (t=50 and 175). Subjects were also asked about their perception of the administered treatment, whether it was TI-IC or placebo. At the end of each driving test, subjects were required to retrospectively rate the effort given in performing the test and perceived driving quality.
Laboratory Tests
Three tests were administered to the subjects: critical tracking, hand steadiness and body sway. These were also administered in the preceding studies, but the equipment or procedures were changed in this study.
1. Equipment, not procedures, changed in case of the critical tracking test (cTT). The test had shown no sensitivity to treatments administered in the preceding studies, in spite of the fact that other investigators had used the same test for showing significant effects of much lower THC doses. The validity of the particular MS-DOS version used in the preceding studies was doubtful. Therefore an older Commodore-64 version was employed in the present study. This version of the ( TT had proven its sensitivity to drug-induced sedation in several previous studies conducted by the authors and their colleagues (e.g. Robbe et al., 1989; Ramaekers et al., 1992a). Test duration was approximately 5 minutes and mean Xc was the dependent variable.
2. As discussed in the previous chapter, the hand steadiness test examined finger rather than hand steadiness because subjects were allowed to rest their hands on the table. Subjects were not allowed to do this in the present study. The modification was expected to induce greater instability. Therefore, the diameters of holes were increased to avoid ceiling effects of the number of contacts between their sides and the hand-held stylus. The diminishing diameters of the five circular holes were now set to 6.30, 4.70, 3.90, 3.05 and 2.70 mm (0.248, 0.185, 0.154, 0.120 and 0.106 in) respectively. The dependent variable was again the square root of the total number of contacts of the stylus with any side. The test lasted about 3 minutes.
3. Postural instability, or body sway, was measured using the stabilometry method (Kapteyn et al., 1983). It involved the use of a balance platform that measures the location of the vector of force which extends vertically downward from the body's center of gravity and its movement over time. Analog output of force transducers within the platform were digitized and analyzed to yield simultaneous measures of lateral and sagittal motion around the vertical axis. Subjects were instructed to maintain a static posture while standing over the center of the balance platform with their feet together.
Two, 30-second recordings followed. The first with the subject's eyes open, the second with eyes closed. While standing with the eyes open, the subject was required to fixate on a target mounted on the wall from a distance of 2.0 m (6.6 ft). The mean area circumscribed by the vertical vector of force (i.e. curve surface, in mm-') was taken as the dependent variable (cs-o and cs-c for eyes open and closed, respectively).
Physiological Assessments
The electrocardiogram (EcG) was measured from precordial leads (Rc,), and the interbeat interval (iBt) times were registered continuously during the driving tests. Cardiac interval times were analyzed to yield three different parameters, mean IBI, the coefficient of variation (cv-im), and a spectral measure of heart rate variability (PwR-HR). CV-IBI, is defined as standard deviation of IBI divided by the mean. It is the best measure of IBI variability in the time domain. The coefficient of variation, and not the standard deviation, of IBI is preferable because of the latter's confounding by mean IBI. PWR-HR is a spectral measure of heart rate variability and calculated from the time series of instantaneous heart rates, which are computed at each successive heart beat. Spectral variability is expressed as the 'squared modulation index' (Van Dellen et al., 1985) which is comparable to the squared coefficient of variation in the time domain if it is integrated over the whole spectrum (0.01-0.50 Hz). PWR-HR is defined as the integration of spectral density values between 0.07 and 0.14 Hz.
Mean interbeat interval, and more frequently its reciprocal, mean heart rate, is frequently used for measuring THC's chronotropic cardiac effect. As shown in the previous study, the measure is valuable for assessing the course of the drug's activity over time. However the other measures, CV-IBI and PWR-HR, possess greater psychological significance. They are alternatively used for estimating relative changes in an individual's mental workload, or more correctly the amount of mental effort he must exert for handling a particular workload. In general, both measures vary inversely with the imposed mental workload or the increase in mental effort which is required to cope with a constant workload while maintaining the same level of performance efficiency under the influence of drugs or fatigue (Mulder, 1980; Mulder and Mulder, 1981).
Blood Sampling
Blood samples were obtained from the subjects by venepuncture immediately before they were transported to the test site and immediately after their return, or approximately 35 and 190 minutes after initiation of marijuana smoking. Two aliquots containing 10 ml each were heparinized and centrifuged, and the plasma fractions were placed in frozen storage for later assays to determine [THc] and [Thc-cooH]. The analytical procedures were the same as those employed in the preceding studies.
Data Analysis
The first step executed was determining the reliability and consistency of performance and subjective parameters measured in the successive placebo treatment conditions. Test-retest reliability coefficients were determined and mean differences between data collected in successive conditions were tested for significance using repeated measures MANOVA. Previous studies wherein unmedicated subjects performance was repeatedly measured in the standard test have failed to show any significant changes over time intervals as long as one week; and, test-retest reliability coefficients for the SDLP measure have always been higher than r= .80. However, intervals separating successive placebo tests were longer in the present study and the reliabilities of measures obtained in the car following test had yet to be determined. For these reasons it appeared necessary to check the consistency of the subjects' performance in the present study.
Subsequently, data from drug and placebo conditions on the first, second and third levels were analyzed separately. Performance variables recorded on ratio or interval scales were subjected to repeated measures MANOVA with Sex as a between-groups and Drug (placebo versus marijuana) as a within-subjects factor. The effect of Time of testing (2 levels) was, if pertinent, simultaneously tested as a within-subjects factor in the same analyses.
It appeared that marijuana's effects on reaction time in the car following test were confounded by mean headway. Reaction times were therefore also analyzed by means of covariance analysis, using headway as the covariate. Covariance analysis estimates what the scores on one variable (in this case, reaction time) would have been if the same 'average' score on another variable (in this case, mean headway) would have occurred in all conditions. It allows one to estimate the effects of THC on reaction time independently of those on headway.
Willingness to drive data were analyzed in the same manner as the parametric data. That is, data from drug and placebo conditions on the first, second and third levels were analyzed separately. Thus, data from both sampling times in a drug condition and its respective placebo condition were simultaneously tested for assessing differences in the proportion of subjects willing to drive for a particular reason.
Separate dose effects were tested using the 'Sequential Bonferroni' procedure for adjusting the a-probability criterion (A) in accordance with the number of separate comparisons in a given set (Overall and Rhoades, 1987). For the largest of three differences tested at once, p had to be less than .05/3= .017 to be judged significant. For the second, it had to be < .05/2—.025; and for the smallest difference, p< .05. The adjustment had the effect of holding the probability of making a type—I error at .05 over the entire set of comparisons.
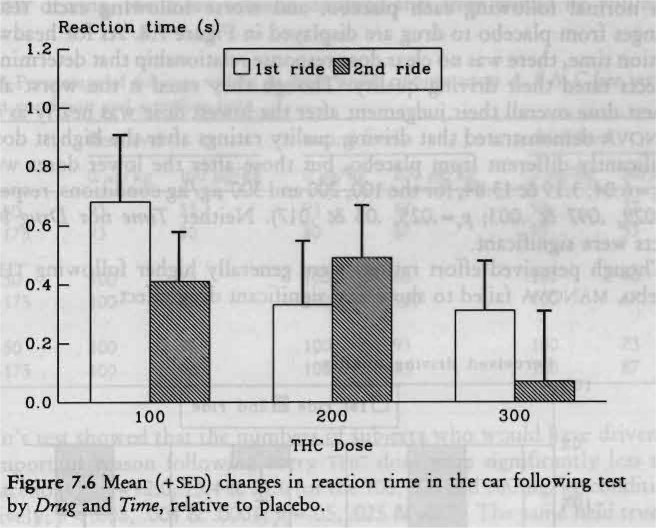
Though data from both the marijuana and respective placebo condition entered MANOVA, figures illustrating the results display mean difference scores (drug—placebo) and standard errors of the difference (sED). The former are depicted by the height of the bars, the latter by the vertical lines above or below the bars. Difference scores were used in order to keep the figures as simple as possible. As a consequence, main effects of Time could not be depicted in the figures: a parallel rise or fall in the mean levels of a variable over time would not affect their difference. This is, however, not a major problem, since it is not very interesting to know whether subjects' performance changed in both conditions in the same manner. More interesting is a Time by Drug effect, which means that the difference between effects of marijuana and placebo changed over time. This effect would be obvious in the figures.
Significant Sex effects were generally absent. Results pertaining to differences between the sexes are therefore mentioned only in the exceptional cases where these were significant.
7.3 Results
No subject dropped out during the experiment, neither on their own initiative nor on the driving instructor's. Therefore, the results presented below include data from fifteen subjects at each level of treatment. It was impossible to obtain every blood sample from one woman, even after repeated attempts. Her data were therefore excluded from all analyses involving drug and metabolite plasma concentrations. However, assays of what samples were obtained indicated that she did inhale THC. Consequently, her data were not excluded from other analyses.
Test-Retest Correlations and Consistency of Performance
Correlations between measurements obtained from the successive placebo treatment conditions are shown in Table 7.3. Correlations between repeated SDLP's were somewhat lower than those obtained in earlier studies for 'normal' subjects, but were still both highly significant and consistent. Mean and standard deviation of speed were also quite reliable. Steering wheel variability, however, was not a reliable measure.
Subjective driving quality ratings were also unreliable, probably due to restriction of range; i.e. most subjects naturally rated their driving performance as about normal (100%) following placebo treatment. Perceived effort ratings were somewhat more reliable, indicating that driving under the conditions of this study was consistently a more effortful occupation for some subjects than others.
Car following parameters were not as reliable as those measured in the standard driving test. Performance in the second ride in the first placebo condition was not related to that in the second ride of the second and third placebo conditions. This means that the test still needs further standardization to reduce the error variance of the measures tested. Ratings of perceived effort in the car following test were only slightly more reliable than those obtained in the standard test. Remarkably, ratings of subjective driving quality were highly reliable in the first car following test, but not in the second.
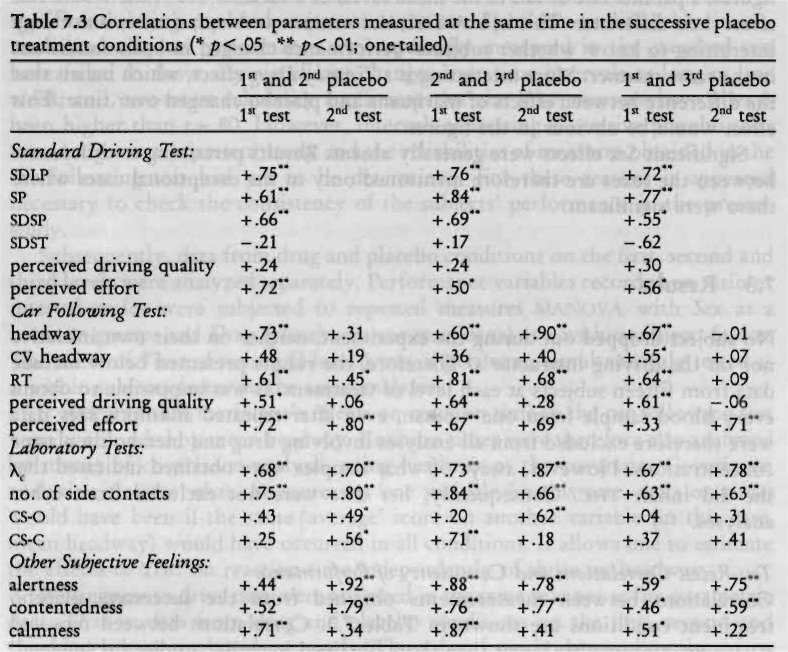
Hand steadiness and X„ but not body sway measures, were highly reliable. Ratings of alertness, contentedness and calmness were moderately reliable. Surprisingly, alertness and contentedness ratings were generally more reliable when measured after driving, in contrast to calmness ratings which were more reliable before the driving tests commenced. Correlations between perceived ratings of 'high' were not computed since they were generally very low or zero following placebo.
Mean differences between data collected in successive placebo treatment conditions were tested for significance using repeated measures MANOVA. Only X changed nearly significantly over successive placebo treatment conditions (F2.12=3.81; p< .052); subjects' performance in this test improved during the study (X=4.6, 4.8 & 5.0, for the respective placebo conditions, averaged across both sampling times). Obviously performance had not reached an asymptotic level during practice trials which preceded the beginning of experimental sessions.
Plasma Concentrations of the Drug
Table 7.4 shows mean, median and range of [Tic] and [iFic-cooH] by Dose and Time. Placebo values were not used in the statistical analyses since these were zero in most cases. Therefore, data from all THC conditions were analyzed in one MANOVA. The tabular data indicate that [THc] was related to inhaled THC dose, and fell to about the same level three hours after smoking.
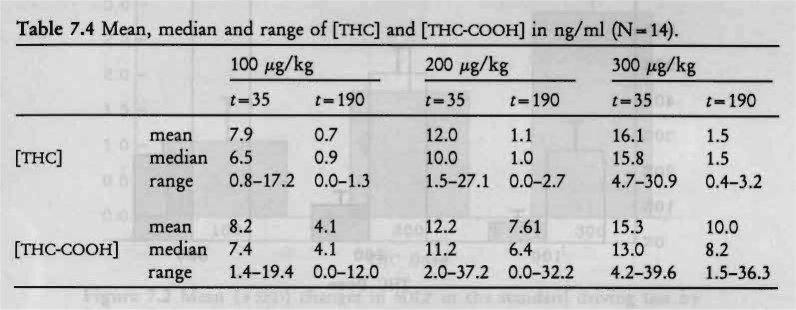
MANOVA confirmed this impression with significant Dose (F2,1 , =20.75; p < .001) and Time (F1,12= 54.81; p <.001) effects, and Dose by Time interaction (F.,,„ = 17.80; p < .001). Males had somewhat higher [THc] than females and the Sex effect approached significance (F1,12= 4.60; p< .053); Sex by Dose interaction was not significant.
Plasma levels of the metabolite, THC-COOH, were about the same as those of THC 35 minutes after initiation of smoking, but did not decline as rapidly. Table 7.4 shows that [THc-cooH] was also dose-related at both sampling times. Significant Dose (F2,11 = 14.49; p < .001) and Time (F ,,,2= 62.50; p < .001) effects, but no Dose by Time interaction, were shown by MANOVA.
Perceived 'high'
Ratings of 'high' after placebo were near zero in most cases. Therefore changes occurring after marijuana smoking, relative to placebo, instead of the raw values, were analyzed by MANOVA. Average subjective feelings of 'high' were dose-related and greatest just before the first driving test (Figure 7.1). Relative to maximum personal experience, peak levels of intoxication were about 30%, 50% and 75% after 100, 200 and 300 rig/kg doses. The approximately linear correspondence between the administered dose and average subjective response was impressive.
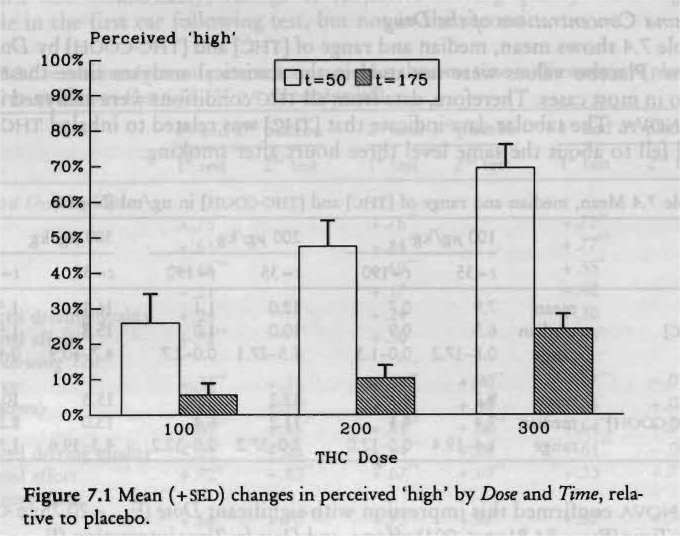
Change scores were significantly dose-related (F2,12=35.07; p< .001) and time-related (F,,,= 40.25; p < .001). The decline in feelings of 'high' over time was also dose-related, resulting in a significant Dose by Time interaction (F212=7.87; p< .007).
Driving Performance in the Standard Driving Test
All subjects undertook and completed each test in a safe manner; the driving instructors neither terminated any ride prematurely nor intervened while subjects were driving. In other words, the subjects' safety was never compromised.
Figure 7.2 shows the mean changes in SDLP from placebo to marijuana conditions. Performance after consuming THC was worse than after the respective placebo treatment; mean changes in SDLP were 1.1, 1.8 and 2.9 cm for the 100, 200 and 300 p.g/kg conditions, respectively. MANOVA showed that SDLP was significantly elevated after inhaling both the higher, but not the lowest, THC doses relative to placebo (F13 = 2.66, 6.63 & 10.16 for the 100, 200 and 300 pg/kg conditions, respectively; p < .13, .023 tic .007; pc= .05, .025 & .017).
No significant differences between males and females were discovered.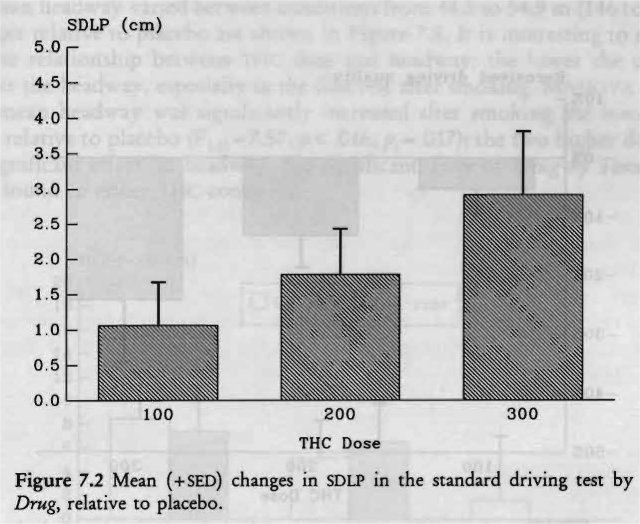
Mean speed was very close to that established as the target by instructions and varied between conditions from 94.5 to 96.1 km/h (58.7 to 59.7 mph). Subjects drove slower following marijuana than following placebo, but the mean differences were quite small: 0.3, 1.1 and 0.5 km/h (0.2, 0.7 and 0.3 mph) for 100, 200 and 300 tg/kg conditions, respectively. MANOVA showed that only the change after the intermediate dose was significant (F113=8.05; p < .014; p= .O17).
Standard deviation of speed was very small in each condition, on average 2.5% of mean speed. Though speed variability increased after smoking THC, the effects were minor and not significant. Standard deviations of steering wheel movements were also not affected by THC; mean changes after smoking THC were essentially nil.
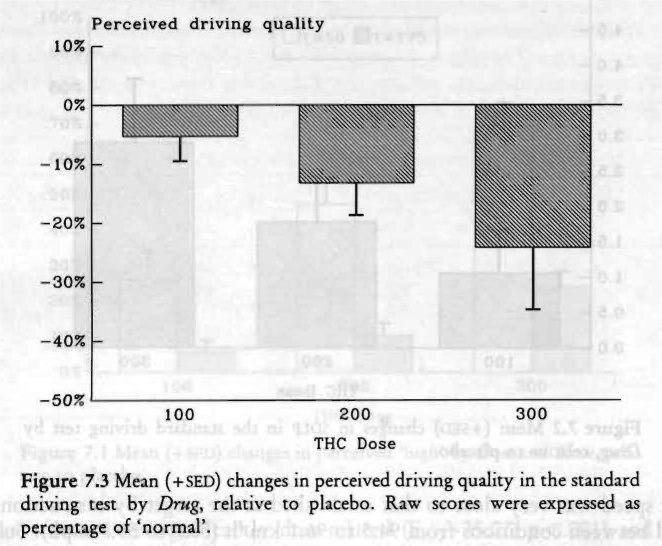
Subjects rated their driving performance in the standard test as about 'normal' after smoking placebo and after the lowest dose of THC. Ratings were 90% and 77% of 'normal' driving performance following the 200 and 300 Ag/kg conditions, respectively. Changes relative to placebo are shown in Figure 7.3. MANOVA demonstrated that changes in perceived driving quality approached the levels of significance required by the Tonferroni' adjustment after the two higher THC doses (F1,13=5.29 8c 5.42 for the 200 and 300 hg/kg conditions, respectively; p<.039 fic .037; p,=.025 tic .017), but were not significantly different from placebo after the lowest THC dose.
Changes in perceived effort ratings were trivial after the two lower THC doses. Effort did increase from 29% after placebo to 39% following the highest dose. MANOVA failed, however, to reveal any significant effects of THC on perceived effort.
Half of the subjects performed the driving tests in darkness, the other half under daylight conditions. Therefore, repeated measures analysis was again applied to the data, but now with Light/Darkness as a between-groups factor. No significant differences were found between the groups for any variable.
Driving Performance in the Car Following Test
All subjects were capable of performing the car following test in each treatment condition. There was no need for the driving instructors to ever intervene or prematurely terminate the test. In one instance, a subject needed the driving instructor's help after smoking the highest THC dose. The subject appeared confused when he took his seat in the car prior to the first car following test. The driving instructor noticed the subject's uncertainty as to what he should do and advised him to turn the engine on. Thereafter, the subject had no problems following the instructions and completing the ride.
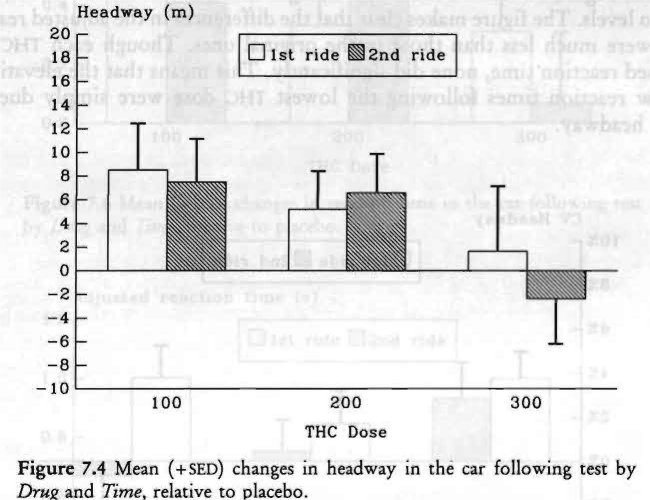
Mean headway varied between conditions from 44.5 to 54.9 m (146 to 180 ft); changes relative to placebo are shown in Figure 7.4. It is interesting to note the inverse relationship between THC dose and headway: the lower the dose the greater the headway, especially in the first test after smoking. MANOVA showed that mean headway was significantly increased after smoking the lowest THC dose, relative to placebo (F103=7.57; p < .016; pc= .017); the two higher doses had no significant effect on headway. No significant Time or Drug by Time effects were found in either THC condition.
Coefficients of variation of headway, expressed as a percentage, were high and varied between conditions from 18.8% to 23.7%. Figure 7.5 shows an inverse relationship between cv headway and administered dose, with the exception of the first ride after the highest dose. MANOVA revealed a significant effect following the lowest dose (F103= 16.62; p< .001; p,= .017), but not the higher doses. Drug by Time interaction approached significance following the highest dose (F103=4.85; p<.046; p,=.017); 300 Ag/kg THC produced an increased headway variability in the first test after smoking, but not in the second.
Mean reaction time to perceived changes in the preceding car's speed varied from 1.56 to 2.30 s, between conditions. The changes, shown in Figure 7.6, followed a similar pattern as those of headway; the greatest increase of reaction time occurred after the lowest THC dose, and the smallest after the highest dose. Reaction times were significantly increased after smoking both 100 Ag/kg and 200 Ag/kg THC, but not 300 itg/kg (F1,13= 10.78, 6.26 & 1.88, respectively; p< .006, .027 & .193; p=.017, .025 & .05). Reaction times were, however, strongly related to mean distance (r=0.76, across all conditions). This is understandable: the further apart two cars are, the more difficult it becomes for the subject to perceive changes in the preceding vehicle's velocity.
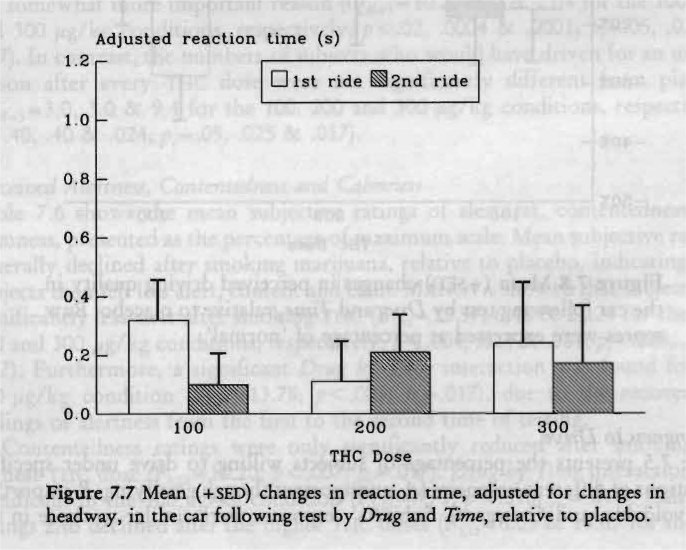
One may question what the effect of THC on reaction time would have been if subjects had driven at the same mean headway in all conditions? Covariance analysis of reaction time with headway as covariate was applied to answer this question. Figure 7.7 shows the mean changes in adjusted reaction times, from placebo levels. The figure makes clear that the differences in the adjusted reaction times were much less than those in the original ones. Though each THC dose increased reaction time, none did significantly. This means that the elevation in the raw reaction times following the lowest THC dose were simply due to a longer headway.
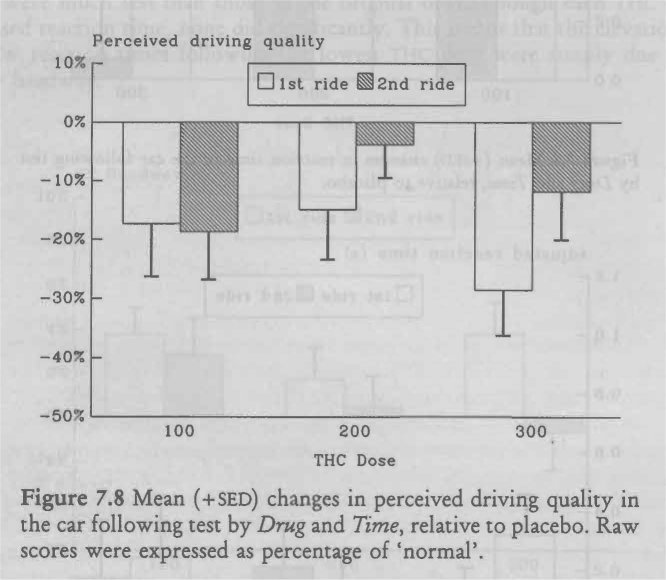
Subjects rated their driving quality in the car following test as somewhat better than normal following each placebo, and worse following each THC dose. Changes from placebo to drug are displayed in Figure 7.8. As for headway and reaction time, there was no clear dose-response relationship that determined how subjects rated their driving quality. Though they rated it the worst after the highest dose overall their judgement after the lowest dose was nearly as critical. MANOVA demonstrated that driving quality ratings after the highest dose were significantly different from placebo, but those after the lower doses were not (P1.1,— 6.04, 3.19 & 13.84, for the 100,200 and 300 jig/kg conditions, respectively; p< .029, .097 & .003; pc= .025, .05 & .017). Neither Time nor Drug by Time effects were significant.
Though perceived effort ratings were generally higher following THC than placebo, MANOVA failed to show any significant drug effect.
Willingness to Drive
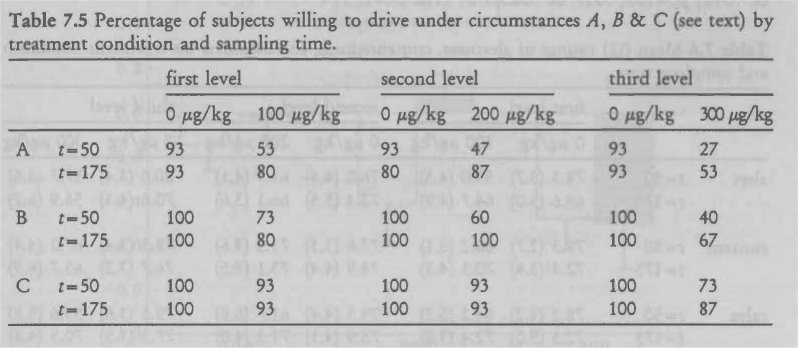
Table 7.5 presents the percentage of subjects willing to drive under specified conditions of different urgencies (A. unimportant though gratifying; B. important but avoidable; and C. urgent). Subjects' responses were similar to those in the previous study. The lower the administered THC dose and the more urgent the reason for driving, the more subjects declared that they would be willing to drive.

Cochran's test showed that the numbers of subjects who would have driven for an unimportant reason following every TI-IC dose were significantly less than after placebo (Qdf_3= 12.0, 13.4 & 21.6 for the 100, 200 and 300 Ag/kg conditions, respectively; p < .008, .004 & .0001; pc= .05, .025 & .017). The same held true for the somewhat more important reason (Qcii_3= 10.2, 18.0 & 21.4 for the 100, 200 and 300 ttg/kg conditions, respectively; p < .02, .0004 & .0001; p=.05, .025 & .017). In contrast, the numbers of subjects who would have driven for an urgent reason after every THC dose were not significantly different from placebo (Qd-3=3.O' 3.0 & 9.4 for the 100, 200 and 300 Ag/kg conditions, respectively; p < .40, .40 & .024; pc= .05, .025 & .017).
Perceived Alertness, Contentedness and Calmness
Table 7.6 shows the mean subjective ratings of alertness, contentedness and calmness, presented as the percentage of maximum scale. Mean subjective ratings generally declined after smoking marijuana, relative to placebo, indicating that subjects then felt less alert, content and calm. MANOVA showed that subjects felt significantly less alert after smoking THC (F1,13=12.57, 6.48 & 21.24 for the 100, 200 and 300 Ag/kg conditions, respectively; p < .004, .024 & .001; pc= .025, .05 & .017). Furthermore, a significant Drug by Time interaction was found for the 100 Ag/kg condition (F,,13-13.78; p < .003; pc=.017), due to the recovery in feelings of alertness from the first to the second time of testing.
Contentedness ratings were only significantly reduced after smoking the highest THC dose (F1,13— 10.20; p<.007; pc— .017). Drug by Time interaction was significant in the 100 Ag/kg condition (F1,13=7.71; p < .016; pc...017). Calmness ratings also declined after the higher mc doses (F1,13=6.05 & 14.65 for the 200 and 300 Ag/kg conditions, respectively; p < .029 & .002; pc=.025 & .017), and Drug by Time interaction approached significance in all conditions (F1,13=4.33, 6.62 & 5.10 for the 100,200 and 300 Ag/kg conditions, respectively; p < .058, .023 & .042; .05, .017 & .025).
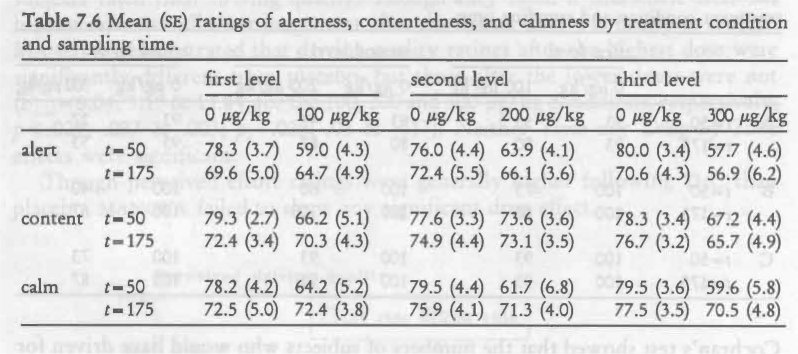
In summary, subjects felt less alert, content and calm after smoking each THC dose, relative to placebo. The effects were strongest and persisted throughout the testing session after smoking the highest dose.
Critical Tracking Test
As shown in Figure 7.9, mean k measured 30 minutes after initiation of smoking diminished in a dose-related manner. Measured 3% hours after initiation of smoking, k remained low after the highest, but not the two lower doses. The lowest THC dose did not affect X. significantly. A nearly significant Drug by Time interaction was found in the 200 gig/kg condition (F,,,3= 4.69; p< .05; p, = .017); i.e. that dose diminished k shortly after smoking, but the effect dissipated after three hours. The highest dose had a significant effect on k (F3=9.03; p< .01; p, = .017), both shortly after smoking and three hours later.
Hand Steadiness Test
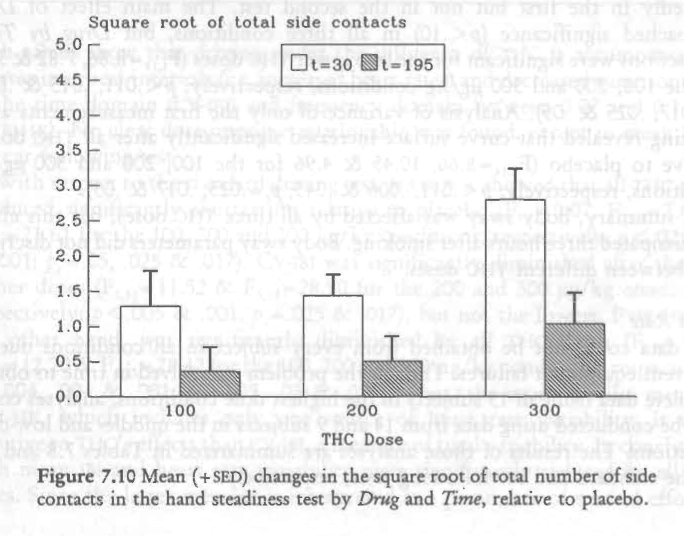
Hand steadiness diminished in relation to the dose after marijuana smoking (Figure 7.10). All doses produced significantly greater instability (F1.13- 6.72, 13.05 & 45.33 for the 100, 200 and 300 Ag/kg conditions, respectively; p< .022, .003 & .001; A-.05, .025 & .017).
Instability diminished after three hours, irrespective of the dose, resulting in significant Time effects in each drug-placebo comparison. Drug by Time interaction was not significant after the lowest dose, but approached significance after the higher doses (F1,t3=4.51 & 6.28 for the 200 and 300 jag/kg conditions, respectively; p< .053 & .026; p, = .025 & .017).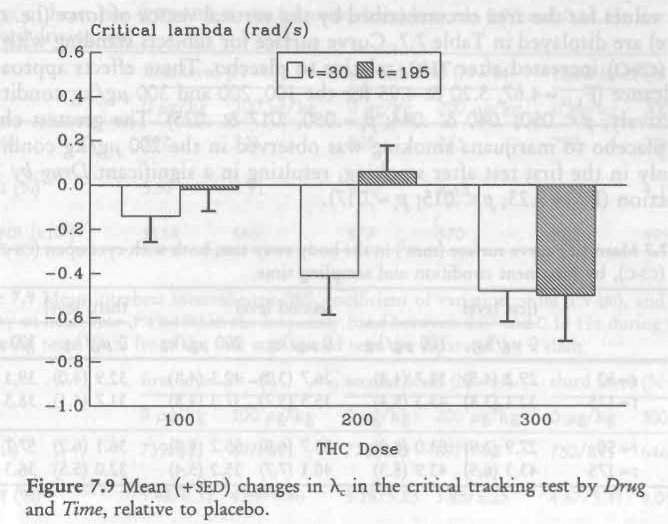
Body Sway
Mean values for the area circumscribed by the vertical vector of force (i.e. curve surface) are displayed in Table 7.7. Curve surface for subjects standing with eyes open (cs-o) increased after THC, relative to placebo. These effects approached significance (171,1,=4.67, 5.20 & 4.95 for the 100, 200 and 300 pg/kg conditions, respectively; p < .050, .040 & .044; pc= .050, .017 & .025). The greatest change from placebo to marijuana smoking was observed in the 200 lig/kg condition, but only in the first test after smoking, resulting in a significant Drug by Time interaction (F,,,3= 9.23; p< .015; /71= .017).
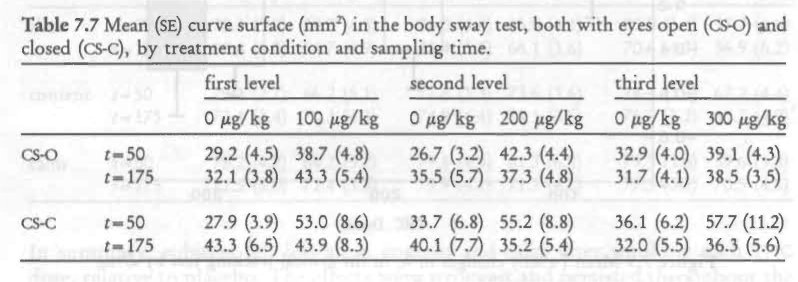
Mean curve surface for the subjects standing with eyes closed (CS-C), increased markedly in the first but not in the second test. The main effect of Drug approached significance (p < .10) in all three conditions, but Drug by Time interactions were significant for the two lower THC doses (F,,,3= 8.86, 7.82 & 3.55 for the 100, 200 and 300 Fig/kg conditions, respectively; p<.011, .015 & .082; p, .017, .025 & .05). Analysis of variance of only the first measurements after smoking revealed that curve surface increased significantly after all TI-IC doses, relative to placebo (F1,14-8.66, 10.45 & 4.96 for the 100, 200 and 300 itg/kg conditions, respectively; p< .011, .006 & .043; pc= .025, .017 & .05).
In summary, body sway was affected by all three THC doses, but this effect had dissipated three hours after smoking. Body sway parameters did not discriminate between different THC doses.
Heart Rate
ECG data could not be obtained from every subject in all conditions due to recurrent equipment failures. Though the problem was solved in time to obtain complete data from all 15 subjects in the highest dose conditions, analyses could only be conducted using data from 14 and 9 subjects in the middle- and low-dose conditions. The results of those analyses are .summarized in Tables 7.8 and 7.9 for the standard and car following tests, respectively.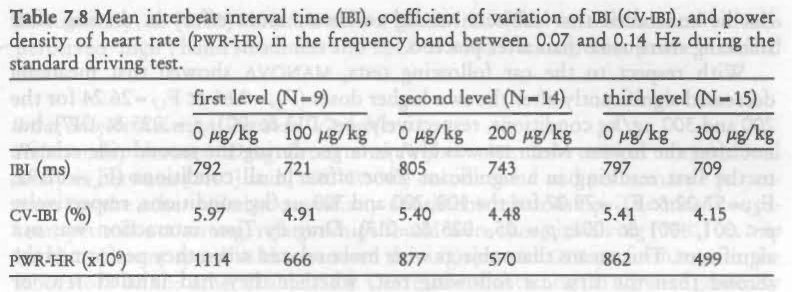
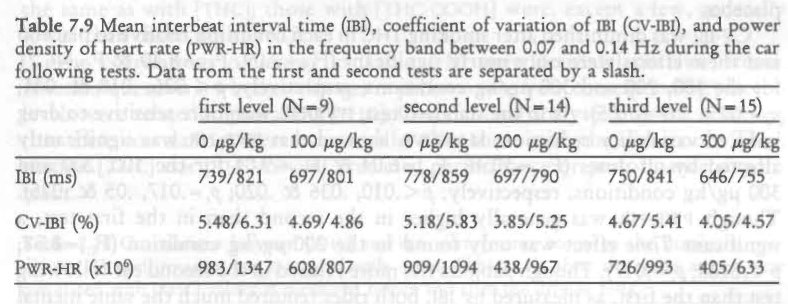
Both tables show that driving under the influence of THC is accompanied by shorter interbeat intervals (i.e. increased heart rates) and decreased variation both in the time domain (CV-IBI) and frequency domain between 0.07 and 0.14 Hz (PWR-I-IR). No clear dose-response relationship was found, except in mean IBI in the car following test.
With respect to the standard driving test, MANOVA showed that all THC doses produced significantly shorter IBIS relative to placebo (F17=9.07, F1,12=7.63 & F1,13=21.61 for the 100, 200 and 300 tg/kg conditions, respectively; p< .02, .017 & .001; 17,-= .05, .025 & .017). CV-IBI was significantly diminished after the two higher doses (F11.,= & F1.13=28.90 for the 200 and 300 ttg/kg conditions, respectively; p< .005 & .001; p,=.025 & .017), but not the lowest. ..PWR-HR, on the other hand, was significantly diminished by all nic doses (F7= 18.62 F1,12=12.20 & FI,13= 28.47 for the 100, 200 and 300 ttg/kg conditions, respectively; p‹.004, .004 & .001; pc=.025, .05 & .017). Thus, the more specific measure, PWR-HR, which includes only one source of heart rate variability, is more sensitive to THC's effects than CV-1BI, a measure of total variability. In conclusion, both mean IB1 and heart rate variability were significantly reduced by all THC doses. Since the latter measure is interpreted as a parameter of mental effort, it can be concluded that subjects needed to invest more effort in driving after smoking marijuana than after placebo.
With respect to the car following tests, MANOVA showed that mean 1BI decreased significantly after the two higher doses (F0=9.66 & F1,7=26.24 for the 200 and 300 tig/kg conditions, respectively; p < .013 & .001; pc=.025 & .017), but not after the lowest. Mean 1BI was always larger during the second ride relative to the first resulting in a significant Time effect in all conditions (F0=52.92, F0-57.02 & F1.7=79.07 for the 100, 200 and 300 lag/kg conditions, respectively; p<.001, .001 & .001; p=.05, .025 & .017). Drug by Time interaction was not significant. This means that subjects were more relaxed when they performed the second than the first car following test, whether they had inhaled THC or placebo.
CV-IBI was diminished after smoking THC in each condition relative to placebo and these effects were only nearly significant (F0=7.09, F0=8.40 & F1.7=6.21 for the 100, 200 and 300 jig/kg conditions, respectively; p< .026, .018 & .041; p‘.= .025, .017 & .05). As in the standard test, PWR-HR was more sensitive to drug induced variability reduction; MANOVA showed that PWR-HR was significantly affected by all doses (F0=10.46, F0=6.04 & F7=9.01 for the 100, 200 and 300 jig/kg conditions, respectively; p< .010, .036 & .020; p,= .017, .05 & .025). Though PWR-HR was generally higher in the second than in the first test, a significant Time effect was only found in the 200 jig/kg condition (F1,9=8.58; p< .0168; pc=.017). Though subjects felt more relaxed in the second car following test than the first, as measured by IBI, both rides required much the same mental effort, as measured by heart rate variability.
Intra-Subject Relations between Variables
The average intra-subject correlation between rnic] and perceived 'high' was, as in the previous study, very high (R=0.90; p<.01). The correlation between measured SDLP and [Thic] measured before driving was 0.63 (p< .05), individual correlations ranging from -.14 to .96; between SDLP and [THc] measured after driving 0.57 (p < .05), individual correlations ranging from -.10 to .92. These correlations closely resemble those found in the previous study where SDLP correlated 0.59 and 0.42 in the first and second tests, respectively. This means that the change in driving performance, as measured by SDLP in the standard driving test, is, within individuals, moderately related to the existing [THc]. Performance in the car following test was not significantly correlated with ['MC].
The square root of the number of side contacts in the hand steadiness test was significantly correlated to ITHc] and perceived 'high' (both r= .66; p < .01). SDLP scores were significantly related to hand instability measured before driving (r= .52; p < .05), but not with scores obtained after driving (r— .35; ns). None of the other laboratory performance measures were either related to plasma concentrations of the drug or to driving performance.
In summary, as [Thc] varied within a given individual so did that individual's perceived 'high', hand steadiness and SDLP or road tracking error in the standard test.
Inter-Subject Relations between Variables
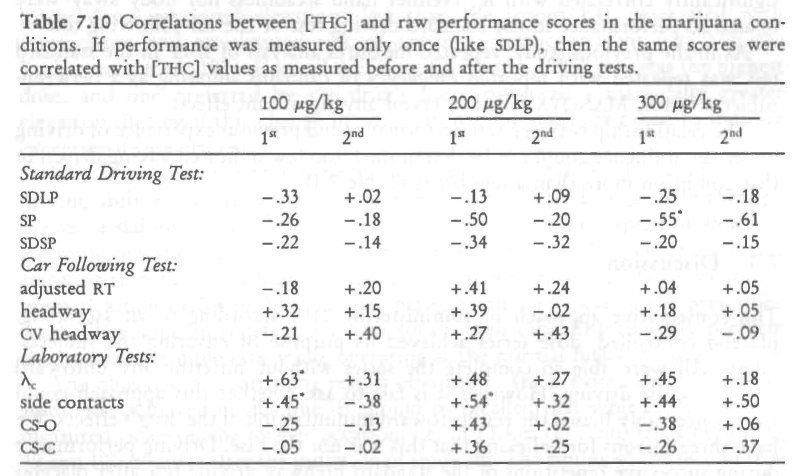
Relationship between Drug Levels and Performance. Inter-subject correlational analysis between [itic] and tmc-c00H1 on one hand and performance parameters on the other failed to reveal any consistent relationship. The most consistent, yet still not strong, relationships found were those involving [THc] on one hand and mean speed in the standard driving test and CTT performance in the laboratory on the other (Table 7.10). Correlations with Log [THc] were generally the same as with [Ti-IC]; those with [Thc-coo] were, except a few, generally lower than those with rnici.
The correlations presented in Table 7.10 were derived from raw scores. Another question is whether changes in performance from corresponding placebo levels were related to prevailing [ific]. Correlational analyses showed, however, that these correlations were even smaller than those with the raw scores. Thus, neither [nic] nor [THC-0001-11 predicted performance or performance impairment.
Relationship between Driving Impairment and Willingness to Drive. In general, the average road tracking impairment in the standard test of those subjects, who indicated before the driving tests commenced that they would normally not have driven under the imagined circumstances, was greater than of those who would have driven. Statistically, these effects were neither significant when willingness to drive for 'unimportant though gratifying' reasons was used as the grouping factor, nor when willingness to drive for 'urgent' reasons was used. This was probably due to the small number of subjects who would not have driven under the former condition, and would have driven under the latter condition. When willingness to drive for 'important, but avoidable' reasons was used as the grouping factor, no significant difference in road tracking impairment was found between the groups after the highest TUC dose; but, following the two lower doses, subjects who would not have driven were significantly more impaired than those who would have driven (F,,= 10.38 & 6.93 for the 100 and 200 jig/kg conditions, respectively; p < .007 & .021; pc —.O17 & .025).
Relationship between Driving Performance and Other Measures. In the previous study, SDLP was moderately correlated with k from the CTT. The present study showed the same pattern of correlations i.e. -.41 and -.50 in the 100 Ag/kg condition, -.49 and -.37 in the 200 Ag/kg condition, and -.58 (p< .05) and -.54 (p< .05) in the 300 pg/kg condition. Despite the interesting theoretical aspects of these consistent results, correlations of such magnitude are generally considered too low for predictive purposes. Performance in the car following test was not significantly correlated with X. Neither hand steadiness nor body sway were related to performance in the standard driving test or the car following test.
As in the previous study, repeated measures analysis of SDLP in the standard test was repeated with reported Frequency of cannabis smoking as a between-subjects factor. MANOVA failed to reveal any significant effect.
The relationship between test performance and previous experience of driving under the influence could not be determined: too few indicated having driven in that condition more than a few times (Table 7.1).
7.4 Discussion
The conservative approach of administering TI-IC according to an ascending, placebo controlled, dose series achieved its purpose of ensuring the subjects' safety. All were able to complete the series without suffering any untoward reaction while driving. However it is fair to ask whether this approach could have conceivably biased the results toward minimization of the drug's effects. We have three reasons for believing that this was not the case. Driving performance during successive repetitions of the standard highway driving test after placebo smoking was relatively constant, so that the reference for judging effects of every dose's effects was essentially the same. The measured mean changes in SDLP after the lowest and highest THC doses in the present study were about what they had been in the previous study where dose orders were counterbalanced. Finally, there was apparently one dose sequence effect on car following performance but it was the opposite of any which could bias the results toward minimizing Thin effects. Such a bias would have existed if the subjects choose to operate more cautiously as doses ascended. Yet as described below, they appeared to operate most cautiously in the car following test after the lowest dose. If any bias existed in this test it was toward maximizing, rather than minimizing THC effects.
Road tracking performance in the standard test was impaired in a dose-related manner by THC. The 100 ptg/kg dose produced a slight elevation in mean SDLP (1.1 cm), albeit nearly significant. The 200 gig/kg dose produced a significant elevation (1.8 cm), of dubious practical relevance. The 300 ii.g/kg dose produced a highly significant elevation (2.9 cm) which may be viewed as practically relevant but unexceptional in comparison with similarly measured effects of many medicinal drugs.
For example, diazepam given for one week in its lowest therapeutic dose (5 mg, thrice daily) caused anxious patients to drive with a mean SDLP about 7 cm higher than their premedication baseline (Van Laar et al., 1992). Furthermore, THC's effects on SDLP were, after the 100, 200 and 300 Ag/kg doses in this study, about the same as those of BAcs=0.02, 0.04 and 0.06 g% according to the empirical equation described by Louwerens et al. (1985, 1987). The comparison reinforces our impression of the relevance of SDLP changes after Ti IC. The two lower doses produced elevations less than the lowest BAC associated with intoxication and an elevated risk of causing a traffic accident (i.e. 0.05 g%; Borkenstein etal., 1974; Council on Scientific Affairs, 1985), whereas the highest dose, and one preferred by the drug's users, produced a marginally greater elevation. But even this change in SDLP can not, by itself, be taken to indicate exceptional impairment.
It is often reported that subjects compensate for THC's adverse effects on driving abilities by operating at slower than normal speeds, especially through curves or slaloms. Our subjects were instructed to maintain a speed of 95 km/h (58 mph) unless compelled to slow down for safety reasons. Following marijuana smoking they drove with an average speed that was only slightly lower (maximum, 1 km/h or 0.6 mph) than after placebo and very close to the prescribed level. They apparently felt that it was within their capability to safely perform this relatively simple task while operating at the normal highway speed.
The objective of confirming results obtained in the previous closed highway study was achieved in this one. It should be recalled that subjects' SDLPs were measured twice on the former occasion; i.e. in 22 km (13.7 mi) trials beginning 40 and 100 minutes after the initiation of smoking. The timing of the second trial most closely corresponded to that in the present study so their respective results will serve as the basis for comparison. Mean SDLP elevations after the lowest and
111 highest doses differed little between the two studies: 100 Ag/kg, 1.4 and 1.1 cm; and 300 Ag/kg, 2.4 and 2.9 cm, respectively. Mean SDLP elevations after the 200 itg/kg dose differed somewhat between studies, being 3.3 cm in the first case and 1.8 in the second. Yet the results of the first study were anomalous in two respects. Not only did the former group's reaction in the 2" trial exceed that in the 1" trial following the 200 ig/kg dose, it was also greater than their 2nd trial reaction after the 300 rig/kg dose. Both results were in contradiction to plasma TI-IC concentrations measured at these times. Thus the peculiar elevation in mean SDLP during the 2nd trial after the intermediate dose was probably a consequence of sampling error. That it was not replicated in the present study should dispel any notions to the contrary.
The car following test in its present form was implemented for the first time in the present study. In it, subjects maintained a headway of 45-50 m (148-164 ft) while driving in the successive placebo conditions. They lengthened mean headway by 8, 6 and 2 m (26.2, 19.7 and 6.6 ft) in the corresponding THC conditions after 100, 200 and 300 keg/kg, respectively. The initially large drug-placebo difference and its subsequent decline is a surprising result in need of an explanation. If one considers that changes in headway after THC results from impaired distance perception, the inverse relationship between administered dose and mean headway defies explanation. But if one considers these differences as the results of the subjects' caution in approaching the task under the influence of Ti-IC on successive occasions, another explanation seems plausible.
Performing the car following test in the company of investigators while under the influence of THC was a novel experience for all subjects. Neither the investigators nor the subjects could predict how the latter would be able to operate the vehicle. The former were somewhat apprehensive and it would not be surprising if the latter were also, particularly, on the first occasion the test was performed after THC inhalation. Subjects were required to match their vehicle's speed with that of the preceding vehicle's and so were unable to reduce velocity as a compensatory action. They could however maintain a longer headway and thereby slightly increase their margin of safety which might be needed if THC retarded their reactions. We believe they did so after receiving the lowest THC dose. When nothing untoward happened and the subjects' confidence in their ability to control the vehicle grew, they apparently tended to diminish headway after each of the succeeding doses so that it came progressively closer to the distance measured after all of the placebo treatments. Thus our explanation for the initial difference between headways maintained after THC and placebo, and why it diminished in subsequent pairs of these conditions, is that the subjects' caution was greatest the first time they undertook the test under the influence of THC and progressively less thereafter.
The only other plausible explanation is that lower THC doses induce a greater sense of caution than higher doses. There is of course no way to determine which of the two explanations is valid from the results of this study. But the fact that the subjects reported feeling less calm and content as the doses increased seems to contradict the notion that they simultaneously became less cautious. Whatever explanation is favored, it is clear that large doses of THC have little effect on mean headway during car following.
Reaction time to changes in the preceding vehicle's speed increased following THC treatment, relative to placebo. The administered THC dose was inversely related to the change in reaction time, as it was to headway. Mean increases in reaction time were 0.55, 0.41 and 0.19 s following the 100, 200 and 300 Ag/kg dose, respectively. However, reaction time data were confounded with headway. That is, increased reaction times were partly due to longer headway. Statistical adjustment for this confounding resulted in smaller and non-significant increases in reaction time following marijuana treatment, the greatest impairment (0.32 s) being observed in the first test following the lowest THC dose. Headway variability followed a similar pattern as mean headway and reaction time; the greatest impairment was found following the lowest dose.
A secondary objective of the study was to determine whether degrees of impairment would correlate between the two tests in a manner indicating a general influence of THC on driving behavior. The results obtained in this study showed that this was not the case; a significant dose-related impairment was found with road tracking, but not with car following. Test duration can not have been the critical point, since the standard test in the previous study was of the same duration as the present car following test.
The car following test was both less sensitive and reliable than it could be following the removal of certain procedural flaws. Intervals between successive maneuvers were practically constant and the preceding vehicle's deceleration was both abrupt an stereotyped. Thus the occurrence and nature of the maneuvers were highly predictable for the subjects.
Greater irregularity in both the timing of maneuvers and the profile of velocity changes would probably increase the sensitivity of the test. After the fact we recognized that the indirect and discontinuous method used for measuring headway produced a degree of error variance which appreciably reduced the reliability of these data. Equipment has become available since the initiation of this study which now makes it possible to measure headway directly and continuously (i.e. an inexpensive pulsed laser reflection recording system). Use of this equipment should increase the reliability of headway measurement in future applications of this test. Finally, the greatest source of error variance was the procedure of allowing the subject to assume, within limits, whatever headway he/she chooses. Whether this is a flaw or not depends upon one's desire to measure or control headway at the beginning of maneuvers. However the subject's choice of headway is certainly a factor which inflates reaction time error variance. Adjusting the data statistically to overcome the confounding effect of headway on reaction time is only a partial solution to the problem. We would probably have been wiser to strictly enforce headway control in order to increase
the reliability of reaction time measurements and their sensitivity to drag effects.
Without trying to minimize the impact of procedural errors on the data, it is doubtful whether any flaw or all in combination seriously obscured a practically important THC effect. SDLP recorded in the standard highway driving test was about as sensitive to low-dose THC effects as any of the traditional laboratory performance measures taken in the study. Moreover the average intra-subject correlation between [TEtc] and SDLP was as high or higher than any measured between the drug's plasma concentration and another performance variable. This relationship could not have been measured if SDLP were not one of the most sensitive parameters known for measuring the effects of THC. The fact that car following performance was less sensitive does not mean that it would have failed to reveal effects of practical importance if these truly existed. SDLP showed no such effects even after the highest dose.
The reasons why SDLP and not car following performance showed the modest impairing effects of THC may have less to do with the inadequacy of the latter test than to the difference between what the two tests measure. SDLP is controlled by a very fast and high capacity human information processing system which operates in a wholly 'automatic' manner. That is, outside of conscious control. The process is relatively impervious to environmental changes as shown again by the high reliability of SDLP under repeated placebo conditions in the present study. It is, however, highly vulnerable to internal factors that retard the flow of information through the system. THc and other drugs are among these factors. When they interfere with the process to elevate SDLP there is very little the afflicted individual can do in way of compensation. Car following performance on the other hand depends upon more discrete perception of events leading to a conscious decision, a response selection and its execution. Performing the test involves far more sustained attention and conscious effort than does road tracking in the standard test. Because car following performance is under conscious control and well within the speed limitations of 'cognitive' compensatory mechanisms it is possible for individuals to recognize their deficiencies and correct them by effort that increases attention. In short, any deficiencies that Ti-IC might have otherwise produced may have been overcome by the subjects' compensatory effort. The cost of effort focused on accomplishing a task is however accompanied by less capacity left for performing another in parallel. The subjects indeed related that their investment of effort in the first car following test increased with the administered dose, and relative to corresponding placebo levels, more so than in the standard driving test. Though these differences were not statistically significant in either case, they were in line with the significant reduction in heart rate variability, that occurred independently of mean rate changes after every THC dose, including the lowest. Together the findings support the premise that THC increases the requirement for compensatory effort during car following which maintains constant performance, but possibly reduces the capacity for undertaking any activity in parallel. Coupled with THC's reputably adverse effect on the ability to divide attention between tasks performed simultaneously (Smiley, 1986) , the net effect might constitute a more serious impediment to safe driving than any observed in this study. It will be interesting to explore this possibility in further research.
Subjects' report of their willingness to drive under specified conditions of different urgencies were similar to those in the previous study. The lower the administered THC dose, and the more urgent the reason for driving, the more subjects declared that they would be willing to drive. Furthermore, there was a tendency for subjects who would normally not have driven to be more impaired in road tracking than those who would. Apparently these subjects recognized their respective degrees of impairment while under the influence of every TI-IC dose. This is supported by the subjects' judgments of their own driving quality which changed in a realistic dose related manner after marijuana smoking.
Critical tracking and hand steadiness tests were more sensitive to THC induced impairment than in the previous study. This confirms our impression that the earlier CTT version was poorly conceived. It also indicates that applying the correct procedures for measuring hand steadiness is very important; i.e. subjects should not be allowed to rest their hand on the table while performing the test. Both tests showed dose-related impairment shortly after cessation of smoking. When the tests were repeated three hours later, hand instability was still present though to a lesser degree. The effect of the highest but not the two lower doses on CTT performance persisted undiminished from the first to the second test, or over a 3-hour period after smoking. These results partially confirm results obtained by Sharma and Moskowitz (1975). They found that THC 200 fig/kg had a virtually undiminished effect on tracking performance for up to four hours. The time course of postural instability after marijuana smoking followed a different profile. All THC doses increased body sway to the same extent shortly after cessation of smoking but none did three hours later.
An important practical objective of this study was to determine whether degrees of driving impairment can be accurately predicted from either measured concentrations of THC in plasma or performance measured in potential roadside 'sobriety' tests of tracking ability or hand and posture stability. These results, like many reported before, indicate that none of these measures accurately predicts changes in actual driving performance under the influence of THC. CTT performance came closest but even its correlation with driving was only r= .50. However, that test might well be included in a battery of similarly predictive tests, measuring different abilities, to collectively yield a single more predictive index of impairment.
| < Prev | Next > |
|---|


