CHAPTER 8 MARIJUANA, ALCOHOL AND URBAN CITY DRIVING
| Books - Influence of Marijuana on Driving |
Drug Abuse
CHAPTER 8 MARIJUANA, ALCOHOL AND URBAN CITY DRIVING
8.1 Introduction
In the previous study, THC doses of 200 iig/kg, and higher, produced significant impairment of road tracking, but not car following, performance. The lowest dose, 100 Agikg, failed to produce significant effects on road tracking, but increased headway during car following.
The latter observation was interpreted as the result of increased caution, since mean headway did not change following subsequent higher THC doses. It therefore seems that low doses of THC do not, or only slightly, impair driving performance. Yet normal driving is far more complex and varied than simply maintaining a safe lateral position and headway during uninterrupted travel on a highway. A THC dose having no effect on these parameters might still impair driving performance in more complex urban driving situations.
There were logical and safety reasons for restricting the THC dose in the third driving study to that which had failed to produce significant impairment in the second. Both the 200 and 300 Ag/kg doses impaired performance on the highway and could be expected to do so again in the urban driving environment. There the consequences of high dose TI-IC effects are more difficult to predict and therefore safely control. The 100 pg/kg dose had some significant effects on the highway but none that could rightfully be called dangerous. This dose might still cause impairment in more complex city driving, but the risk was judged to lie within the realm of the acceptable. For that reason it was given to a group of regular cannabis users, along with placebo in the present study.
For comparative purposes another group of regular alcohol users were treated with a modest dose of their preferred recreational drug, and again placebo, before undertaking the same test. It was hoped that this addition would not only verify the sensitivity of the test but also allow a comparison between effects of recreational drugs that Dutch society considers as illicit and licit when both are given in relatively low doses. The comparison was not designed to show that one drug is 'safer' for use by drivers than the other. Surely neither are safe when consumed before driving in high doses. However if respective low dose effects are comparable then one would be justified to conclude that THC may be considered as posing a traffic safety hazard which is in some respects similar to alcohol's.
The only study that has been conducted in actual traffic before this program started was also a city driving study. Klonoff (1974) assessed the effects of two THC doses, 4.9 and 8.4 mg THC which are equivalent to 70 and 120 p.g/kg for a 70 kg (154 lb) person. Aspects of subjects' driving performance were scored by a professional examiner using an abbreviated version of the British Columbia Department of Motor Vehicles' standard driver's licencing test. The results showed that subjects performed less competently when under the influence of the highest, but not the lowest, dose. In particular, they scored lower on judgment and concentration scales. Moskowitz (1985) and Smiley (1986) criticized the method of measuring driving performance on the grounds that the examiners' reliability was never determined and that the scoring instrument had never been shown to provide measures related to driving safety. Smiley questioned, for example, whether ratings of posture and irritability are relevant for good driving performance. These are sound criticisms but one has to assume that Klonoff's approach should have been sensitive to serious driving performance impairment, related to safety, if it had in fact occurred.
Two scoring methods were employed in the present study. The first was in fact a method similar to that applied by Klonoff; i.e. the driving instructor acting as the safety controller during the tests retrospectively rated the driver's performance using a standard scale. This method has been applied previously to show the impairing effects of alcohol (De Gier, 1979) and diazepam (De Gier et al., 1981) in similar situations. Jones (1978) criticized this use of driver licensing assessment procedures. She opposed the lack of precise definitions for many of the behaviors rated by examiners and the requirement for rating all of them at once. In contrast to this 'molar' approach, she developed a more 'molecular' one for evaluating driving proficiency. Her method was also applied in the present study. It involves the employment of specially trained observers who apply simple and strict criteria for recording when the driver makes or fails to make each in a series of observable responses at predetermined points along a chosen route.
The professional observer's global ratings are inherently less reliable than the scores obtained by the molecular rating scheme. Still the molar approach has some advantages. The professional's experience with many drivers operating in all traffic situations provides him with the ability to integrate far more information than is possible to obtain from limited performance sampling. He has internalized a broad concept of acceptable driving performance and applies more flexible criteria for judging when it is unsafe within a particular test situation. Of course the danger that a professional's biases may influence his judgments needs to be overcome by training and his adherence to structured rules which are specific for the investigation. But when this is done, he may provide a more valid estimation of the overall safety of a subject's driving performance. If this were not the case it would be difficult to explain how every developed society relies upon the professional's and not a traffic scientist's opinion of whether a particular individual should be licensed to drive.
The objective of this study would be satisfied in one way if neither observer rating method yielded a significant difference between driving performance after 100 itg/kg THC and placebo. These results would confirm those obtained in the previous study by indicating that the selected dose lies below that capable of impairing driving performance. This conclusion would only be warranted, however, if it could be shown that the tests were sensitive enough to measure significant driving performance impairment after alcohol relative to placebo. If that were not the case, test insensitivity could be judged as the factor responsible for negative results, rather than the lack of a THC effect.
The objective would be satisfied in another way if either or both rating methods showed significant impairment after THC. Such results would indicate that any dose likely to be consumed before driving should be considered hazardous, regardless of whether alcohol's effects were the same, more or less. In the event that significant impairment occurred after THC, we were prepared to determine its relationship with plasma concentrations of THC and THC-COOH measured at about the same time.
8.2 Methods
Subjects
Two groups of sixteen new subjects apiece, equally comprised of men and women, participated in the study. The groups will be referred to by the alcohol and marijuana group. Subjects in both groups were recruited according to the same inclusion/exclusion criteria as before with one exception. Subjects in the alcohol group were regular users of alcohol but not marijuana (see below).
All subjects were individually trained to perform the city driving test in a preliminary 'dress rehearsal' and were familiarized with the other tests and questionnaires.
Plasma analyses after conclusion of the study showed that two males' plasma contained neither THC nor THC-COOH in any sample. It was concluded that these subjects had not inhaled smoke so their data were excluded from further analyses.
Characteristics of the remaining subjects are given in Table 8.1. Except for the reported incidence of marijuana use, there were no significant differences between any of the groups' characteristics.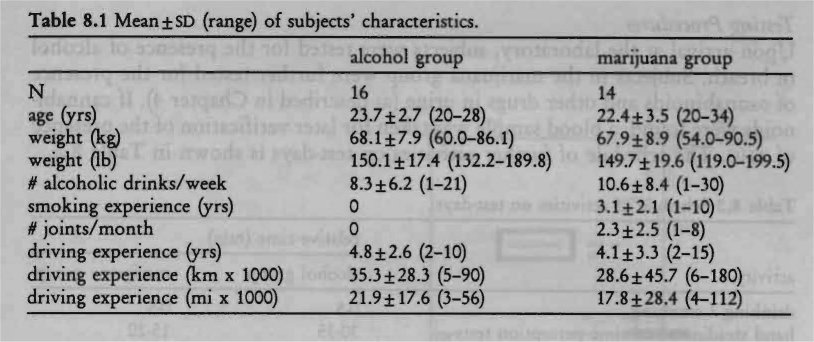
Design, Doses and Administration
The study was conducted according to a mixed between-groups within-subjects design, one group drinking alcohol and placebo alcohol and the other smoking marijuana and placebo marijuana. Alcohol was administered as 99.8% ethanol mixed with orange juice and Grand Marnier essence to a volume of 250 ml. The dose was 0.43 g/kg lean body mass (on average, this resulted in a dose of 0.36 g/kg body weight in males, and 0.31 g/kg in females). Lean body mass was calculated by subtracting the percentage of fat, determined by skinfold thickness (Durnin and Womersley, 1974), from total body weight. The dose vva chosen to yield a Blood Alcohol Concentration (BAc) approaching 0.05 g% when the driving test commenced 45 minutes after onset of drinking. Subjects were instructed to fast 21/2 hours before drinking and to ingest the dose within 5 minutes. Alcohol in the subjects' expired air was monitored using a Lion S-D3 Breath-Alcohol Analyzer to ensure that subjects would not drive with BACs that were higher than 0.05 g%, which is the legal limit in The Netherlands.
The subjects in the marijuana group were treated on separate occasions with THC doses of 0 (placebo) and 100 Ag/kg. Marijuana cigarettes were prepared from batches containing 1.77% THC. Cigarettes appeared identical in both treatment conditions and were smoked through a plastic holder in a fashion determined by the subject but with the constraint that smoking had to be finished within five minutes. After cessation of smoking, cigarettes were retained for subsequent gravimetric estimation of THC consumed. These analyses revealed that the average (± SD) amount of consumed THC in the marijuana condition was 6.9 (±1.0) mg or 101 (±6) p.g/kg.
Half of both groups received the treatments in the same order, the others, in reverse order. The driving instructor and observer who rated subjects' driving performance were blind regarding both the administered drug (active or placebo) and the subject's group membership.
Testing Procedures
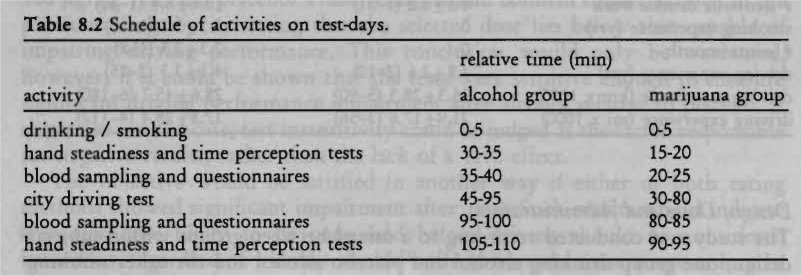
Upon arrival at the laboratory, subjects were tested for the presence of alcohol in breath. Subjects in the marijuana group were further tested for the presence of cannabinoids and other drugs in urine (as described in Chapter 4). If cannabinoids were found, a blood sample was taken for later verification of the presence of THC. The schedule of further activities on test-days is shown in Table 8.2.
Driving Test and Scoring Methods
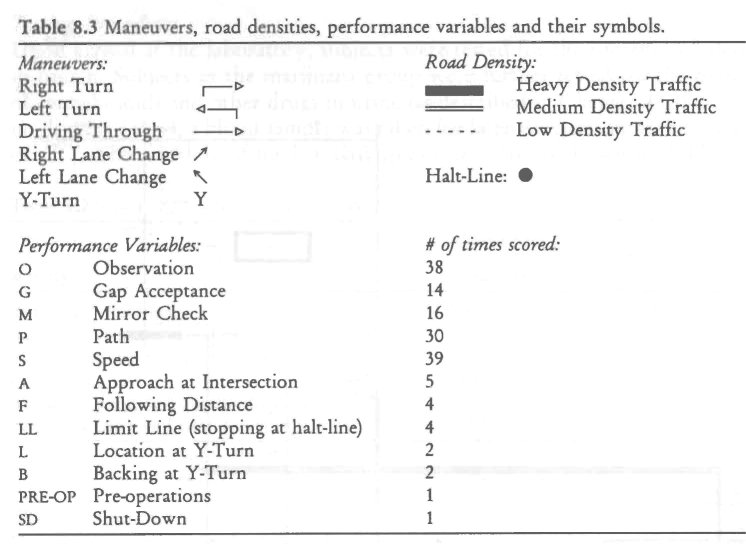
Driving tests were conducted in daylight over a constant 17.5 km (10.9 mi) route within the city limits of Maastricht (population ca. 115,000). The route was constructed through business and residential areas on 2-lane undivided streets and included a 6 km (3.7 mi) 4-lane divided segment on a major cross-city thoroughfare (Figure 8.1). Subjects drove their placebo and active drug rides through heavy, medium and low density traffic on the same day of the week, and at the same time of day. Maneuvers included left and right turns at some intersections and driving through others, left and right lane changes, and responding to traffic control devices (i.e. stop signs and signals). There was one special maneuver, repeated twice; i.e. executing a Y-turn on a residential street. A schematic representation of the standard route is shown in Figure 8.1 and the symbols used for maneuvers and road densities are shown in Table 8.3 (the performance variables will be discussed below).
Driving tests were conducted in a dual control 2-door sedan (Volkswagen Golf) normally used for driving instruction/examination. Two persons accompanied the subject: a licensed driving instructor sitting in the front passenger's seat and an trained observer sitting in the center of the rear seat. The former had access to redundant controls and his primary responsibility were controlling safety and giving the route instructions; and, to rate the driver's performance retrospectively (below) after the ride. The observer in the rear seat scored the driver's performance 'on-line' and timed the duration of the ride.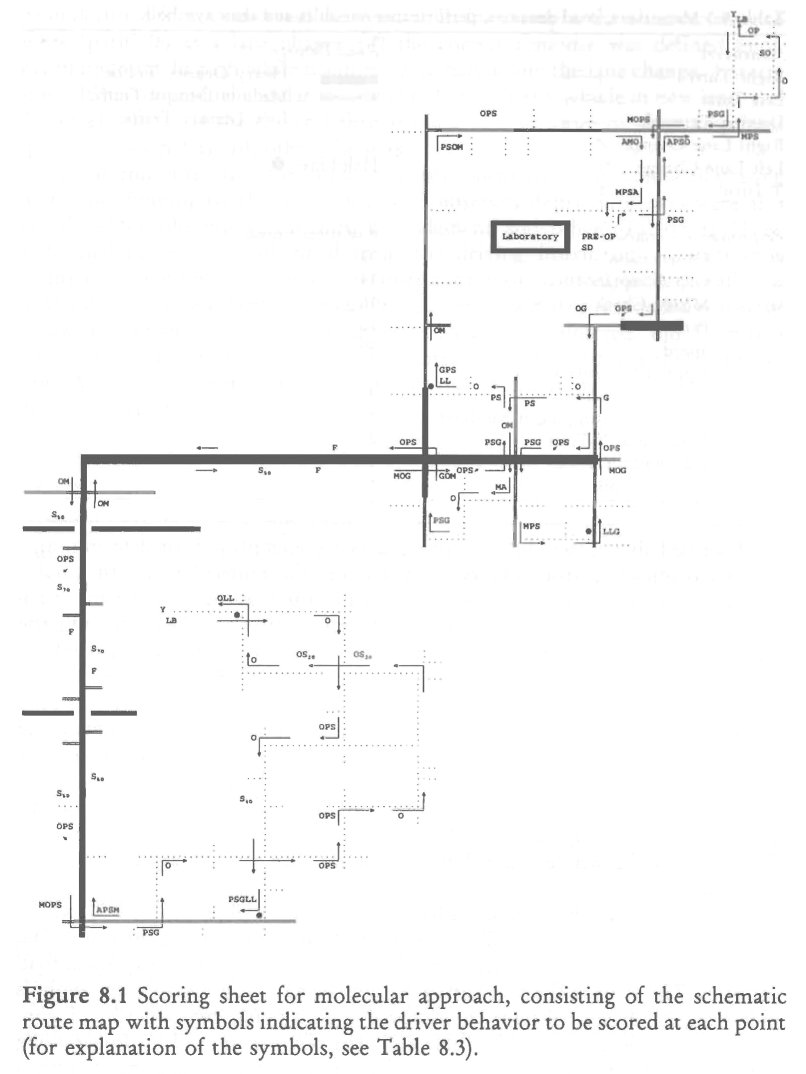
As described above, two different procedures were employed for determining a driver's proficiency from observer ratings; i.e. the molecular and the molar methods. The major difference between both methods is that performance variables are repeatedly measured on-line at different points along the route using the molecular approach; and, only once, retrospectively, in the molar approach.
The molecular approach was adopted from Jones (1978) who simplified the scoring of driving behavior so that the trained observer, sitting in the rear seat, attends to only one event at a time. The events observed at specific points along the route are only few aspects of total driving behavior. Thus, the observer is enabled to attend completely to the occurrence of each event in sequence while ignoring all other behavior which would in any case vary between tests. All aspects of a maneuver, such as a left turn, will be scored a number of times over the course of the whole route, but never more than a single aspect at a given moment.
Jones defined twelve aspects, called performance variables (Table 8.3), which were repeatedly scored, 156 times in total, at specific points along the route. The route was designed to fulfill Jones' requirements concerning maneuvers and road densities. The scoring sheet consisted of the schematic route map with symbols indicating the driver behavior to be scored at each point (reproduced in Figure 8.1 with symbology defined in Table 8.3). The observer moved his finger along the route and attended only to the behavior indicated, comparing it with a predefined standard of performance, and circled (if correct), crossed (if wrong) or underlined (if not observed) the symbol. If, for example, the observer were to score 'path' (P) at a lane change (,) the correct response was defined as: 1. maintains straight path while scanning, 2. signals before the lane change, 3. steers smoothly with gradual angular movement, 4. straightens vehicle in new lane, and 5. cancels signal. If the driver failed to make one or more of these responses 'path' was scored as fail, otherwise pass.
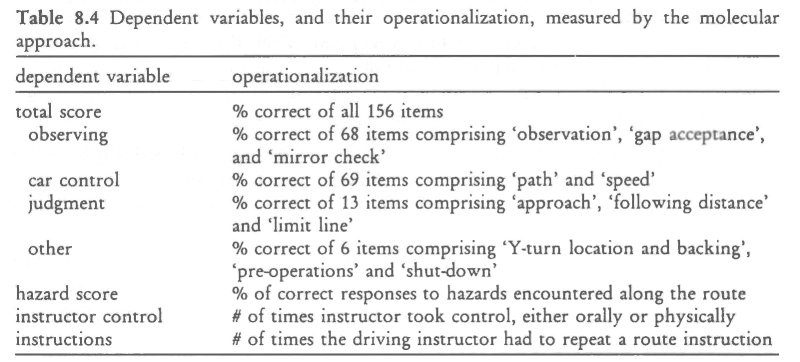
At the end of the test, the 'total score' was calculated by summing all passing items and dividing by the total number of observed items. Subscores were also calculated for 'observing', 'car control', 'judgment' and 'other' (Table 8.4). Three additional scores were obtained from the driving instructor; 1. 'instructor Control', the number of times the instructor took control, either orally or physically, 2. 'hazard Score', the number of times the driver responded correctly to hazards divided by the total number of hazards encountered, and 3. 'instructions', the number of times the driving instructor had to repeat a route instruction. All scores, except 'instructor control' and 'instructions', were expressed as per cent correct.
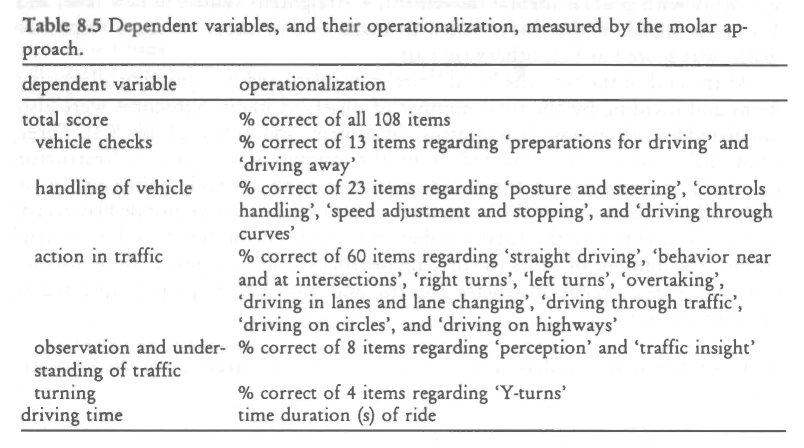
The molar approach required the driving instructor to retrospectively rate the driver's performance using a shortened version of the Royal Dutch Tourist Association's (ANB) Driving Proficiency Test'. This instrument is normally applied for practical purposes; e.g. remedial training, driver's licensing, qualifying for a reduction in insurance premiums, etc. Items that did not apply to the driving test, e.g. those regarding railway crossing and special maneuvers like driving backwards and parking, were dropped from the normal list. In total, 108 items were dichotomously scored, as either pass or fail. Total test performance was measured by the percentage items scored as 'pass'. Subscores were calculated for 'vehicle checks', 'handling of vehicle', 'action in traffic', 'observation and understanding of traffic', and 'turning' (Table 8.5).
Questionnaires
Questionnaires used in the previous studies were administered to the subjects in the present study. Subjective feelings of intoxication (high' or `drunkness'), present cognitive and emotional state, and subjects' willingness to drive were assessed before the onset and after the conclusion of the driving tests. Subjects were also asked about their perception of the administered treatment, whether it was an active or placebo. At the end of each driving test, subjects were required to retrospectively rate the effort given in performing the test and perceived driving quality.
Laboratory Tests
Subjects performed two laboratory tests before and after driving. The hand steadiness test was used since it had shown a significant effect of the 100 rig/kg THC dose in the previous study and confirmation of this result would indicate the equivalent sensitivities of the present and previous groups to the drug. In addition a time perception test (method of interval production; Fraisse, 1963) was used to satisfy the investigator's curiosity about an oft-reported effect of THC. The former followed the same procedures as described in Chapter 7. The latter required the subjects to stand with eyes closed and indicate when he/she thought that 30 seconds had elapsed since a starting signal. The verbal response was timed to the nearest second by stop-watch.
Blood Sampling
Blood samples were obtained by venepuncture immediately prior to and following all placebo and drug driving tests. Two aliquots containing 10 ml each were heparinized and centrifuged, and the plasma fractions were placed in frozen storage for later assays to determine [nic] and [Thic-cooFi], in the marijuana group; and, [ET0H], in the alcohol group. The analytical procedures regarding THC and THC-COOH assays were the same as in previous studies. As before, samples obtained in conjunction with placebo marijuana tests were only analyzed if the urine test had been positive. Plasma samples obtained from subjects in the alcohol condition were analyzed using gas-chromatography.
Data Analysis
For each variable measured on interval or ratio level, except plasma concentrations, change scores were computed by subtracting raw scores obtained in the placebo condition from those in the drug condition. In the figures, the mean change of the variable is depicted by the height of the bar and its standard error (sED) by the height of the vertical line above or below the bar. Change scores were expressed in absolute and not relative units. This means that if a performance measure fell from 80% after placebo to 70% after active drug, the change score would be 10% and not 12.5%. Mean drug-placebo changes were tested for significant departure from zero by 2-tailed t-tests, for each group separately. Differences between the groups' mean changes were tested by 2-tailed t-tests for independent samples. Willingness to drive data were again analyzed for assessing differences between drug and placebo conditions using Cochran's Q-test. Differences between the respective groups' willingness to drive after drug treatments were analyzed by Mann-Whitney's U-test. Correlations were computed by Pearson's r and tested for significant departure from zero by 2-tailed t-tests.
Preliminary analyses were executed to determine whether change scores were significantly different between subjects who received placebo in the first, and active drug in the second condition and those who received treatments in reversed order. Significant differences were generally absent and are therefore mentioned only in the exceptional cases where these were significant.
8.3 Results
Plasma Concentrations of the Drugs
Table 8.6 shows mean, median and range of [THc] and [Thc-cooH] in the marijuana group and [ET0H] in the alcohol group. In the marijuana group, ['Mc] and [THC-0001-1] were in the expected range. In the alcohol group, mean [ET0H] at t=35 was somewhat lower than expected. Furthermore, the fall in [ET0H] to t-95 was less than expected from alcohol's pharmacokinetics; a fall of .02 To per hour is commonly seen during the elimination phase in subjects who fast prior to alcohol intake. This probably means that peak [ET0H] generally occurred during the driving test and was not much higher than measurements taken before and after. This situation contrasts to that for the subjects in the marijuana group whose [Tic] reached its peak before the test and fell much more rapidly during it. Average plasma concentrations were significantly different from zero in all cases (p < .001).

Perceived 'high' and `drunkness'
Mean levels of intoxication reported by both groups varied from placebo to drug conditions in a remarkable manner. Few subjects in either group reported feeling intoxicated after placebo and their average levels were about 5% of maximum personal experience. After both THC and alcohol these levels rose to about 35% when the respective groups were about to begin driving, then declined to 25% at the end of driving. Means and standard errors of differences (sED) in reported intoxication are shown in Figure 8.2.
T-tests showed that ratings of intoxication after active drugs were significantly different from zero in the marijuana and alcohol groups, both before ('T13=4.36 & T15=5.20, respectively; p<.001) and after driving (T13=3.44 ez T15=5.23, respectively; p < .001).
Subjects' responses to the question of whether they thought the administered drug was active or placebo showed that they were well aware of what they smoked or drunk. In the marijuana group, 93% of the subjects correctly identified the placebo cigarette when it was administered, and 79%, the active drug. In the alcohol group, 94% of the subjects correctly identified the placebo alcohol when it was administered, and 87%, the active drug.
Driving Performance Measured by the Molecular Approach
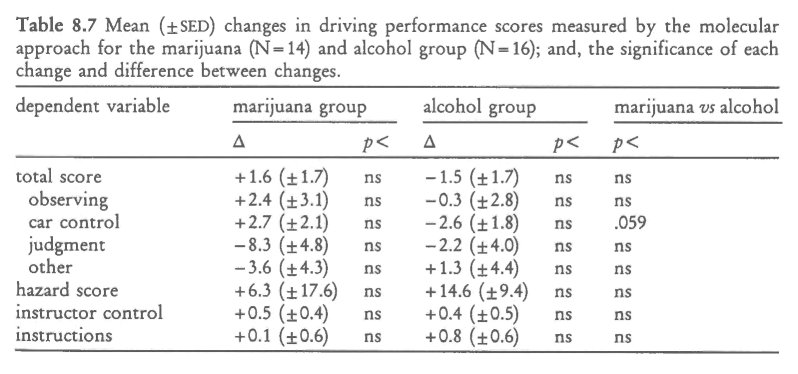
Though some of the changes were positive, indicating better performance after drug and some were negative, showing the opposite, no mean change was significant (Table 8.7). Differences between the two groups' changes were also not significant, although one came close: the difference between improvement shown by the marijuana group and impairment shown by the alcohol group in 'car control' approached significance (p < . 0 5 9) . In general, the effects of both drugs on driving performance, as measured by the molecular approach were very small or absent.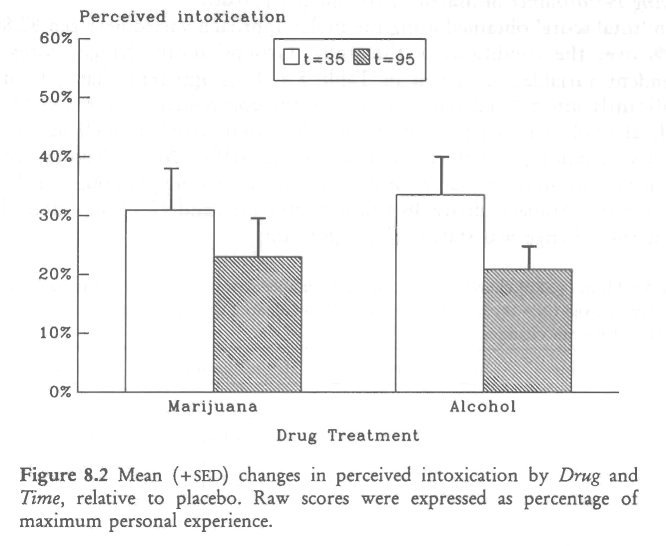
Driving Performance Measured by the Molar Approach
Mean 'total score' obtained using the molar approach varied between 82.8% and 89.5% over the conditions of the study. Groups' mean change scores on all dependent variables are given in Table 8.8. It is apparent that THC did not significantly affect 'total score' or any of the component scores. On the other hand, alcohol significantly diminished the 'total score' as well as two components, 'handling of vehicle' and 'action in traffic'. Mean driving time was, within two seconds, the same for both groups following placebo, namely about 411/2 minutes. Subjects drove 46 s slower after THC and 42 s faster after alcohol, but neither change was statistically significant.
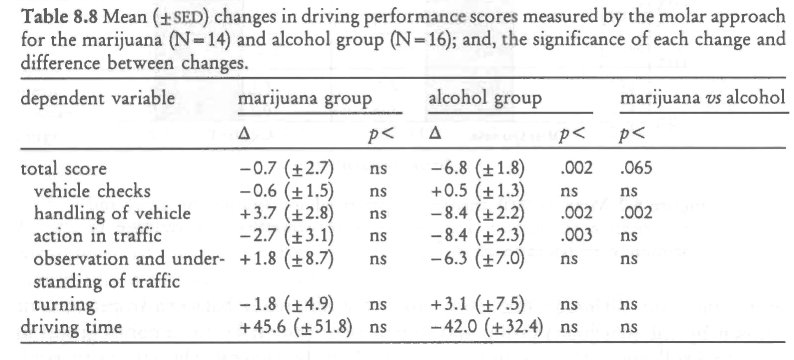
Differences between the groups' mean change scores were also significant or nearly so. The greater drop in 'total score' caused by alcohol was almost significantly different from that caused by THC (p< .065). The difference between groups' changes in 'handling of vehicle', a component score, was significant (p <.002): whereas the marijuana group's performance improved slightly, that of the alcohol group deteriorated under the influence of their respective drugs. In particular, 6 items checked under the category of 'handling of vehicle' discriminated between the groups' reactions to the drugs. These all pertained to how well the driver handled the vehicle through curves. Whereas THC had little effect on this ability, alcohol seemed to affect it strongly. This more than any other factor was responsible for the difference between the instructor's ratings of how the two groups were affected by the respective drugs.
Perceived Driving Quality and Effort to Accomplish the Test
Both groups rated their driving performance .following placebo as somewhat better than 'normal'. Following the active drug, ratings were about 35% lower in the marijuana group, but only 5% lower in the alcohol group (Figure 8.3).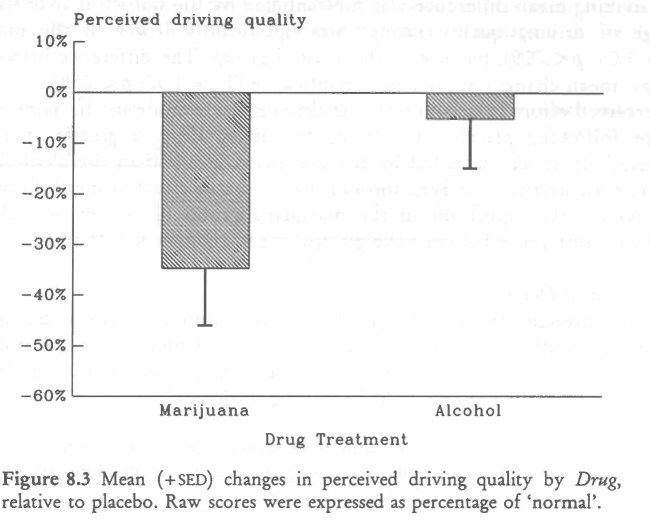
This striking mean difference was substantiated by the statistical analysis. Mean change of driving quality ratings was significantly lower in the marijuana (T13=-3.05; p< .009), but not in the alcohol group. The difference between the groups' mean changes approached significance (T28-1.97; p < .058).
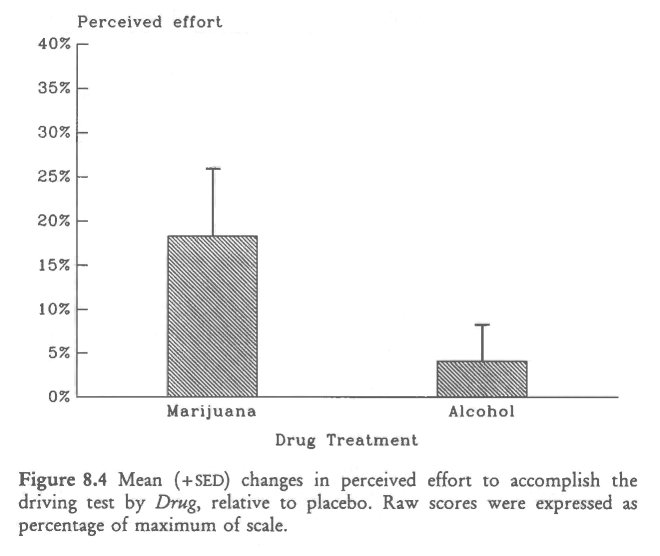
Perceived effort to accomplish the driving test was about the same in both groups following placebo. Following the active drug, a greater increase in perceived effort was reported by the marijuana group than the alcohol group (Figure 8.4). Statistical analysis showed that increased effort ratings following the drug were only significant in the marijuana group (T13=2.39; p<.033). No significant difference between the groups' mean changes was found.
Willingness to Drive
Table 8.9 presents the percentage of subjects willing to drive under specified conditions of different urgencies (A. unimportant though gratifying; B. important but avoidable; and C urgent). The more urgent the reason for driving, the more subjects declared that they would be willing to drive.
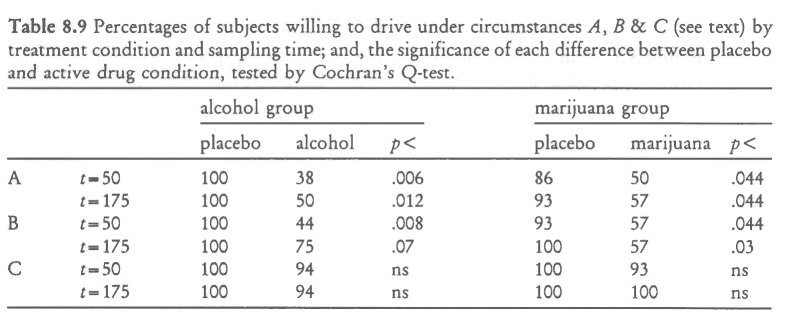
Cochran's Q-test showed that the numbers of subjects who would have driven for an unimportant reason following the active drug were significantly less than after placebo, in both groups. The same held true for the somewhat more important reason. In contrast, nearly all subjects indicated that they would have driven for an urgent reason, irrespective of the administered drug. Mann-Whitney's U-test failed to reveal any significant difference between the groups' percentages following the active drug.
Perceived Alertness, Contentedness and Calmness
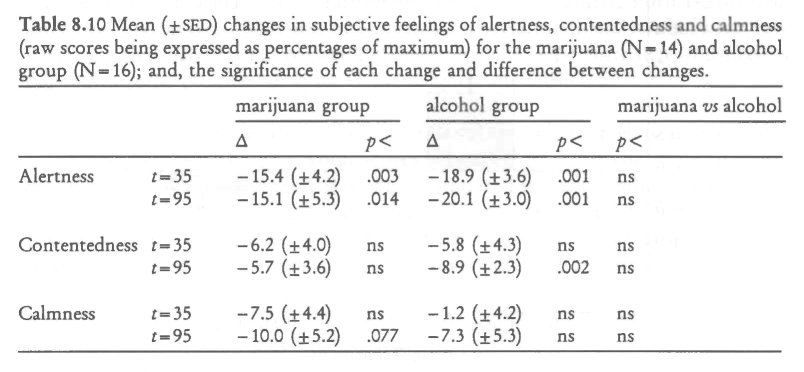
Changes in subjective feelings of alertness, contentedness and calmness are shown in Table 8.10. Feelings of alertness were significantly diminished in both groups and at both time points following the active drug relative to placebo. Subjects felt also less content and calm following the active drugs, but the effects were smaller.
Statistical tests revealed only one significant effect: alcohol producing significantly diminished feelings of contentedness measured after termination of the driving test.
Hand Steadiness Test
Mean square root of total number of side contacts were about the same in the placebo conditions for both groups. The active drugs, however, affected hand steadiness differently; the number of side contacts increased after THC whereas the opposite occurred after alcohol (Figure 8.5). Statistical analysis showed that the impairment following THC was highly significant, both shortly after smoking and more than one hour later (T,3=3.96 8c. 3.40; p< .002 & .005, respectively), whereas the improvement following alcohol was only significant shortly after drinking (T15=-2.29;p< .037). The differences between the groups' mean changes were significant both before and after the driving test (T,8= 4.71 & 3.35; p< .001 & .002, respectively).
Time Perception Test
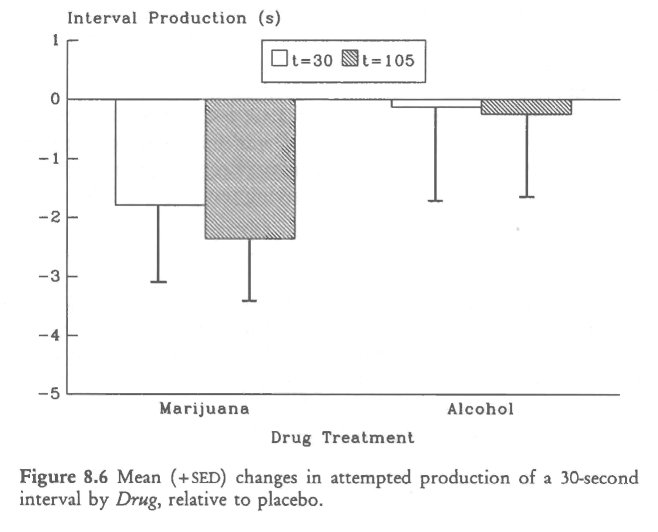
Mean attempted production of a 30-second interval was close to the target for the alcohol group, both after placebo and active drug yielding very small, and nonsignificant, changes (Figure 8.6). Subjects in the marijuana group produced a foreshortened interval in both conditions, but foreshortening was greater following THC. The change in interval production was, however, only significant after, and not before, the driving test (T,3=-2.36; p< .045).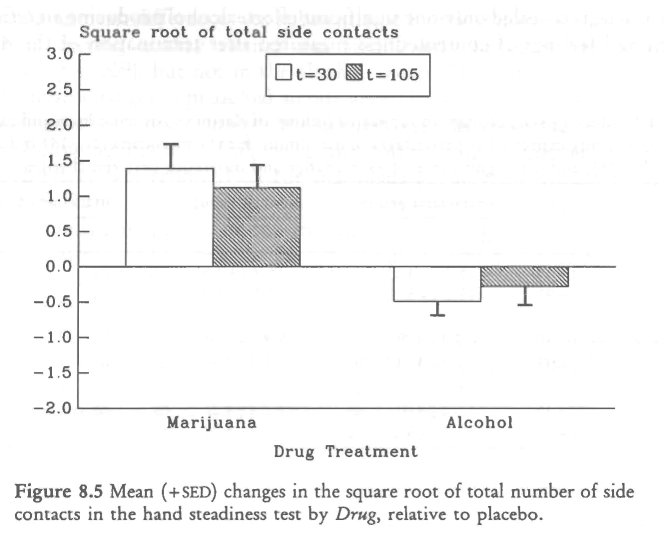
Inter-Subject Relations between Variables
Relationship between Plasma Concentrations and Driving Performance. Correlational analyses were performed to determine whether driving performance was related to plasma concentrations of the drugs, measured both before and after the driving tests. The first step involved correlational analysis between raw variables; the second step, between changes in driving performance and plasma concentrations. Neither analysis yielded significant results.
Relationship between the Molecular and Molar Approach. Correlations were also computed between the raw 'total scores' obtained by both the molecular and molar approach. These correlations were computed in each condition separately. For the marijuana group, the correlation between the Total Scores were 0.71 (p< .005; 2-tailed) and 0.54 (p< .044) in the placebo and active drug condition, respectively. For the alcohol group, the corresponding correlations were 0.71 (p< .002) and 0.79 (p< .001), respectively. Differences between these correlations were not significant. The second step involved correlational analysis of change scores. This analysis revealed that changes in 'total scores' of both methods were not significantly correlated, neither in the marijuana (r = 0.05) nor in the alcohol group (r = 0.08).
Relationship between Driving Performance and Driving Experience. Correlations were also computed between driving experience on one hand, and driving performance and changes in driving performance following the active drug on the other. Neither analysis revealed significant correlations. This means that driving experience of the subjects in the present study could neither predict driving performance per se nor changes following the active drug.
Relationship between Plasma Concentrations and Perceived Intoxication. Correlations of perceived 'high' following THC with [THc] were 0.65 (p< .013) shortly after smoking and 0.47 (p<.093) following termination of the driving test. Correlations with [THc-cooH] were 0.74 (p<.002) and 0.62 (p < .018), respectively. Correlations of perceived intoxication following alcohol and [ETox] were not significant (r = 0.27 & 0.39, respectively). Correlations of plasma concentrations with changes in perceived intoxication were nearly the same as those with the raw scores, because intoxication ratings were generally zero following placebo.
8.4 Discussion
The present study showed that alcohol, administered in a dose of 0.43 g ethanol per kg of lean body mass yielding an average plasma alcohol concentration of about 0.04 g%, produced a significant impairment in city driving as measured by the molar approach, relative to placebo. Significant impairment was shown by changes in 'total score', and subscores describing 'handling of vehicle' and 'action in traffic'. Marijuana, administered in a dose of 100 pEg THC per kg of whole body weight, on the other hand, did not significantly change mean driving performance as measured by this approach. Neither alcohol nor marijuana significantly affected driving performance measures obtained by the molecular approach.
The first conclusion one might draw is that the methods applied for measuring driving performance did not yield exactly the same results. Yet both methods similarly measured individual differences in driving proficiency. Correlations between the total scores in all four conditions were between 0.54 and 0.79, and as such, highly significant. Obviously both methods were able to discriminate the relatively large pre-existing differences in the subjects' respective abilities to operate the vehicle in urban traffic. Change scores were, however, not correlated; i.e. r=0.05 8E 0.08 in the marijuana and alcohol group, respectively. Since the molar, and not the molecular, approach was sensitive to alcohol's adverse effects, it is tempting to conclude that the latter may fail to measure some important driving deficits. That is, the molecular approach seems relatively insensitive to drug-induced changes.
The second conclusion one might draw is that the molar method, having proven its sensitivity by detecting impairment associated with a low BAC, should be sensitive to any similar impairment occurring after a correspondingly low THC dose. That it failed to show any significant change in the marijuana group's driving performance leads to the third and most important conclusion:
The 100 pg/kg THC dose these subjects received shortly before the trst did not impair their city driving performance
The different effects of alcohol and marijuana on driving performance can not be explained by the subjects' reported driving experience. Although subjects in the alcohol group were somewhat more experienced drivers than those in the marijuana group, the difference was not significant. Furthermore, correlational analysis showed that neither driving performance nor driving impairment was significantly related to previous driving experience. The different effects of alcohol and marijuana on driving performance can also not be explained by differences in the groups' subjective feelings. There was a remarkable correspondence between the two groups' feelings of intoxication, i.e. 'high' or `drunkness'. Prior to the driving test, both groups reported intoxication levels of about 35% of the highest ever experienced, and 25%, after its termination. THC's significant impairing effect on hand steadiness also showed that the subjects in the marijuana group were sensitive to THC's effects.
The difference between the drugs' effects on driving may be explained, however, by compensational mechanisms, such as increased effort. Both groups reported about the same amount of effort in accomplishing the driving test following placebo. Yet only subjects in the marijuana group reported significantly higher levels of invested effort following the active drug. Previous on-road driving studies indicate that subjects may compensate for THC's adverse effects by slowing down (Hansteen et aL, 1976; Casswell, 1979; Peck et al., 1986). Results of the present study were in the same direction: it took the marijuana group an average of 46 s longer to complete the circuit after THC than following placebo. That this difference was not significant was probably due to the real-life character of the test: unforseen obstructions and variable traffic density probably increased the error variance of this measure over what it would have been on a closed course. Thus, there was evidence that subjects in the marijuana group were not only aware of their intoxicated condition but were also attempting to compensate for it.
There were other striking differences between the groups' reactions to their respective drugs. As stated, subjects in the marijuana group invested more effort in the test while driving under the influence of THC. The alcohol group apparently made no greater effort after the drug than placebo. Yet for all of their effort, the marijuana group rated their driving performance as being significantly worse after THC than placebo. The alcohol group who invested no special effort after the drug, not surprisingly, thought they had driven as well as following placebo. They were nonetheless driving in a deficient manner according to the instructor's ratings. These seem to be important findings. They support both the common belief that drivers become overconfident after drinking alcohol and investigators' suspicions that they become more cautious and self-critical after consuming low THC doses by smoking marijuana.
These impressions were seemingly contradicted by the similarity in the groups' responses indicating their willingness to drive after the respective drugs. About 50% of both groups said they would have been unwilling to drive for less than very urgent reasons. This profession of caution seems a bit odd for the alcohol group who knew that they could not be given a dose which would produce BACs over the legal limit during the test. The 'contradiction' in this case seems to be a reflection of the group's desire to give 'socially desirable' answers to the questionnaire, whether the same was true for the marijuana group in the present and preceding studies is a moot point.
The laboratory performance tests also discriminated between the drugs' effects. Hand steadiness was impaired following THC and improved following alcohol, relative to placebo. The difference between the drugs' effects was significant, both before and after the driving test. Impairment after THC was about as much as that produced by the same dose in the previous study, indicating equivalent sensitivities of the present and previous groups. Production of time intervals was not affected by alcohol, but THC significantly shortened interval production, relative to placebo. This confirms the common finding that TI-IC affects time estimation (Hollister and Gillespie, 1970; Bech et al., 1973). As usual, THC accelerated the subjects' perception of time passing. They arrived at a foreshortened production of 30 s and would have estimated the duration of the actual interval as longer that it actually was. Changes in driving performance were not correlated with changes in performance in either laboratory test. Nevertheless, both tests should be seriously considered for inclusion in any test battery for measuring these drugs' effects, mainly because of the different pattern of results they produced.
Plasma concentrations of THC and THC-COOH were comparable to those obtained in the previous studies. Plasma concentrations of ethanol were somewhat lower than predicted, and the fall in plasma concentration durincr, the driving test was less than expected. This probably means that peak plasma concentrations generally occurred during the driving test. If so, it probably was about 0.04 g%. Ratings of 'high' were significantly related to plasma concentrations of THC and THC-COOH but those of `drunkness' were not significantly related to plasma concentrations of ethanol. Drug plasma concentrations were neither related to absolute driving performance scores nor to the changes that occurred from placebo to drug conditions. With respect to THC, these results conl irm the findings in previous studies. They are somewhat surprising for alcohol but may be due to the restricted range of ethanol concentrations in the plasma of different subjects.
How do the present results relate to those reported by Klonoff (1974)? He also assessed the effects of relatively low THC doses on aspects of subjects' driving performance in a city driving test using a similar molar approach. His subjects commenced driving immediately after cessation of smoking. They scored lower on judgment and concentration scales when under the influence of the highest, but not the lowest, dose. Behaviors that were more directly related to driving performance, e.g. lane changing, compliance with traffic signals and posted speed advisories, were not affected by the drug. Subjects in the present study commenced driving 30 minutes after initiation of smoking. The molar method applied in the present study did not include ratings of judgment or concentration. With the exception of these two items, neither study indicated significant effects of THC on driving performance and are, therefore, in complete agreement.
'A copy of the test can be obtained from the author or the ANWB, The Hague.
| < Prev | Next > |
|---|


