CHAPTER 6 MARIJUANA AND DRIVING ON A RESTRICTED HIGHWAY
| Books - Influence of Marijuana on Driving |
Drug Abuse
CHAPTER 6 MARIJUANA AND DRIVING ON A RESTRICTED HIGHWAY
6.1 Introduction
As mentioned in Chapter 3, THC's effects on actual driving performance have been assessed in a relatively small number of studies and only once in the presence of other traffic. In those studies, the effects of doses up to about 250 Ag/kg were modest, if present at all. These findings provided some assurance that it would be safe for subjects to undertake carefully supervised driving tests on normal roads and in traffic, even after treatment with the somewhat higher average dose (i.e. 300 Ag/kg) that was preferred by regular marijuana users in the laboratory study. Nonetheless normal prudence demanded a demonstration of the test's safety in an environment resembling reality but where neither the subjects nor other road users would be endangered if the optimistic forecast proved false. One objective of the present study was to provide that demonstration using a standard test on a highway closed to other traffic.
The second objective was to define the dose-effect relationship between inhaled THC dose and that parameter of vehicular control which is measured in the standard test; i.e. standard deviation of lateral position (sDLP), an index of 'weaving' amplitude the subject allows while attempting to maintain a constant speed and steady lateral position between traffic lane boundaries during uninterrupted highway driving. Alcohol's effects on SDLP were previously measured by Louwerens et al. (1985, 1987) in practically the same manner as THC's in this study. The earlier results showing a nearly perfect (r=0.99) exponential relationship between mean blood alcohol concentration (0-0.12 g%) and mean SDLP for 24 'social drinkers', serve admirably for evaluating THC's effects in the present case.
Other objectives were to measure changes in SDLP from tests after placebo to those following separate THC doses of 100, 200 and 300 Ag/kg; and, to relate these objective measures of driving impairment to subjective impressions of driving quality and expressed willingness to drive in the same states of intoxication under normal circumstances.
6.2 Methods
Subjects
The same twelve men and twelve women who participated in the laboratory study served again as the subjects. Plasma from the laboratory study was still not analyzed at the time data collection commenced. The male that apparently did not inhale marijuana smoke was therefore not dropped from the study. As before, his plasma samples showed neither THC nor THC-COOH. Data from this subject had to be again excluded from further analyses. Characteristics of the remaining 23 subjects are shown in the previous chapter (Table 5.1).
Design, Doses and Administration
Subjects were treated on separate occasions with THC doses of 0 (placebo), 100, 200, and 300 Ag/kg. Marijuana cigarettes were prepared from batches containing 1.75% THC for the two lowest, and 2.57% THC for the highest dose. Cigarettes were cut to different lengths to provide the doses appropriate for the individuals' body weights. It was necessary to provide the five largest subjects with two cigarettes at a time since one would not contain the total dose. Subjects smoked the cigarettes through a plastic holder, ad lib, but they were encouraged to smoke the entire dose in ten minutes. After cessation of smoking, cigarettes were retained for subsequent gravimetric estimation of THC consumed. These analyses revealed that the average (± SD) amount of consumed THC in the three marijuana conditions was 6.8 (+0.9), 13.6 (+1.9) and 20.4 (+2.8) mg, which equals 94 (+4), 186 (+13) and 282 (+ 18) pg/kg, respectively, or about 6% less than target doses. Order of treatments were counterbalanced. They were administered subject- and observer-blind (i.e. the investigator who prepared the treatments was not involved in their administration or with data collection).
Testing Procedures
Eight subjects were tested per night and all 24 within a week. Subjects were tested at the same times and on the same days of the week for four consecutive weeks. Breath and urine tests were executed upon the subjects' arrival to check for the presence of alcohol and illicit drugs. If cannabinoids were found in the urine, a blood sample was taken for later verification of the presence of THC.
Two subjects commenced smoking at a time at t=0 (Table 6.1). Driving tests were performed twice, beginning at t=40 and 100 minutes and lasting 15-20 minutes. Blood samples were taken before the driving tests. The subjects' pulse was taken and their performance measured in two laboratory tests that began after the driving tests. Subjective assessments were made immediately after smoking, and before and after the driving tests. Before the start of the experiment, subjects were individually trained to operate the vehicle under generally the same conditions as the tests later occurred.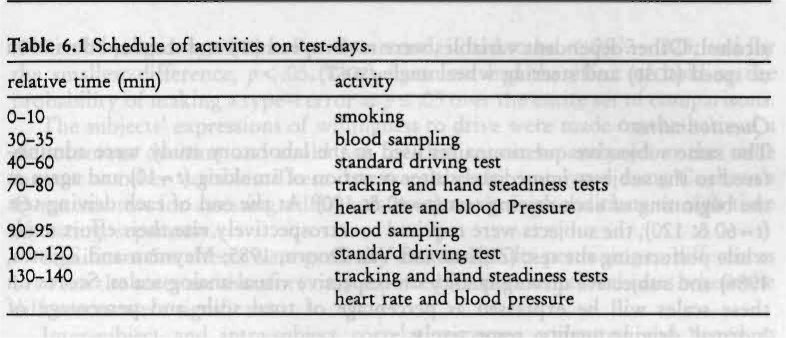
Driving Test
The driving test, developed and standardized by O'Hanlon etal. (1982, 1986) and applied in more than 40 open- and closed-road studies by three Dutch Institutes during the last decade, measures the ability to control an instrumented vehicle's speed and lateral position. Subjects were instructed to maintain speed at 90 km/h (56 mph), or less if they felt incapable of driving safely at that speed, and a steady lateral position between the delineated boundaries of the traffic lane.
Driving was performed over a 11 km (6.8 mi) section of a primary highway (A76) that connects the Dutch cities of Geleen and Heerlen. Two lanes in the same direction were closed to normal traffic between the hours of 19.00 and 24.00 on three consecutive week-nights over four consecutive weeks of testing. Driving began at one end of the section, involved turning at the other and ended with a return to the origin. A licensed driving instructor accompanied each subject. He was charged with responsibility for ensuring safety at all times and was able to intervene, if necessary, using redundant vehicular controls.
Two Volvo station wagons containing essentially the same instrumentation were employed in the study. The first of a pair of subjects who received treatments together departed from the origin driving one vehicle and was followed by the second driving the other after 21/2 minutes. The first subject waited for the arrival of the second at the turning point before returning to the origin. The purpose was to avoid having the subjects, travelling in opposite directions, meet en route. The major instrumentation comprised devices for acquiring continuous analog signals representing steering wheel angle, vehicle speed and lateral position relative to the midline stripe delineation, and a computer system for recording those signals continuously at a 4 Hz sampling rate.
The primary dependent variable was the standard deviation of lateral position (sDLP), which has been shown to be both highly reliable (typical test-retest correlation of 0.7-0.9) and very sensitive to the influence of sedative drugs and alcohol. Other dependent variables were mean speed (se) and standard deviation of speed (spse) and steering wheel angle (sDsT).
Questionnaires
The same subjective questionnaires used in the laboratory study were administered to the subjects immediately after cessation of smoking (t= 10) and again at the beginning of each driving test (t=40 & 100). At the end of each driving test (t=60 & 120), the subjects were required to retrospectively rate their effort made while performing the test (Zijlstra and Van Doom, 1985; Meyman and Zijlstra, 1986) and subjective driving quality on respective visual-analog scales. Scores on these scales will be expressed as percentage of total scale and percentage of 'normal' driving quality, respectively.
Laboratory Tests
Two of the tests employed in the laboratory study were also applied here, namely the critical tracking and hand steadiness tests. Exactly the same procedures were employed in their administration as described in the previous chapter.
Physiological Assessments
Heart rate, systolic and diastolic blood pressure were measured by means of a digital blood pressure monitor prior to the hand steadiness test.
Blood Sampling
Blood samples were taken by venepuncture. The samples (2 aliquots containing 10 ml each) were heparinized and centrifuged. The plasma fractions were placed in frozen (-20°C) storage prior to analysis for [THc] and [THc-cooH].
Data Analysis
All data measured on ratio or interval scales were taken in a mixed between-groups, within-subjects MANOVA analysis. Sex was the between-groups factor. Dose (4 levels) and Time after dosing (2 or 3 levels) were factors tested within-subjects. If a significant (p < .05) Dose effect was found, repeated measures ANOVAs were conducted for testing differences between measures obtained after placebo and each THC dose, separately. Data in these cases were collapsed across Sex and Time unless the MANOVA analysis had revealed a significant interaction between either factor and Dose. In the figures, the mean of the variable is depicted by the height of the bar and its standard error (SE) by the height of the vertical line above the bar.
Separate dose effects were tested using the 'Sequential Bonferroni' procedure for adjusting the a-probability criterion (A) in accordance with the number of separate comparisons in a given set (Overall and Rhoades, 1987). This means that for the largest of three differences tested at once, p had to be less than .05/3=.017 to be judged significant. For the second, it had to be < .05/2 =.025; and for the smallest difference, p< .05. The adjustment had the effect of holding the probability of making a type-I error at p .05 over the entire set of comparisons.
The subjects' expressions of willingness to drive were made on the basis of a dichotomous decision and could not for that reason be analyzed in the same manner as other variables. These data were therefore analyzed using Cochran's Q-statistic test for assessing differences between dosing conditions at each time of testing, separately.
Significant Sex effects were generally absent. Results pertaining to differences between the sexes are therefore only reported for the exceptional cases where the differences were significant.
Inter-subject and intra-subject correlations were computed and tested as described in the previous chapter.
6.3 Results
Plasma Concentrations of the Drug
Though consumed dose differed little between subjects, [THc] and [Ti IC-cool!] varied enormously. Thirty minutes after smoking 300 Ag/kg, for example, [Ti ranged between 1.6 and 59.6 ng/ml. Table 6.2 shows mean, median and range of [Tic] and [Thc-cooH] by Dose and Time. Placebo values were not used in the statistical analyses since these were zero in most cases.
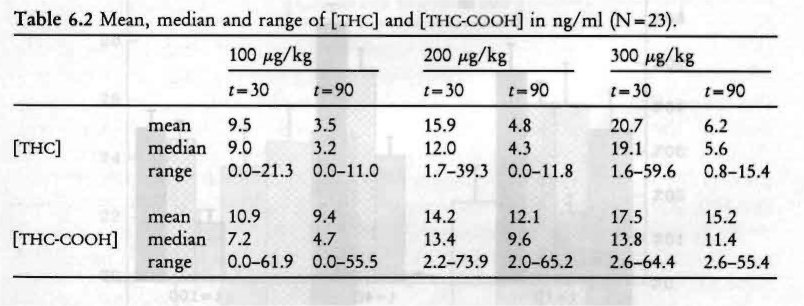
As shown by Table 6.2 plasma concentrations of the drug were clearly related to the administered dose and time of blood sampling. MANOVA confirmed this observation yielding a significant Dose (F2,20=14.65 8z 16.59 for [nic] and [Ti-ic-cooH], respectively; both p< .001) and Time (F1,21=50.76 & 21.16; both p<.001) effect. There was a significant Dose 1y Time interaction for [Tfic] (F2,20=10.07; p < .001) and not [THc-cooH]. Though not shown in the table, males had significantly higher [Thic-cooli] values, 9 ng/ml on average, than females (F1,21 = 4.49; p< .05); average [THc] values were virtually the same for both sexes.
Perceived 'high'
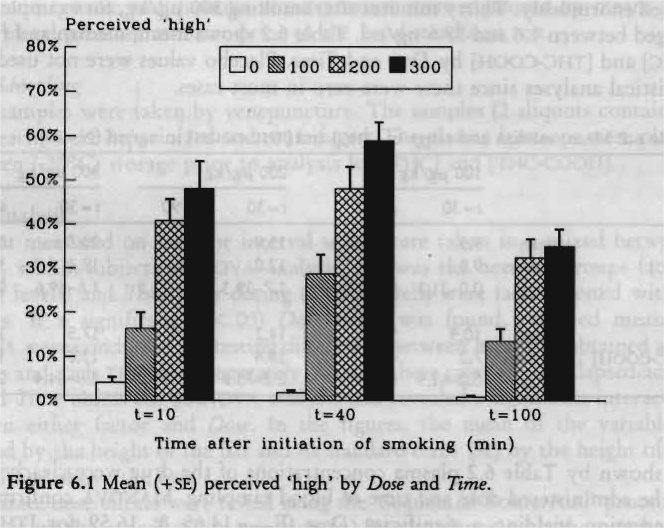
Average subjective feelings of intoxication ('high') were dose-related and highest just before the first driving test (Figure 6.1). Relative to maximum personal experience, peak levels of intoxication were about 30%, 50% and 60% after 100, 200 and 300 tig/kg doses, respectively. Feelings of 'high' after placebo were near zero in most cases. Therefore changes occurring after marijuana smoking, relative to placebo, instead of the raw values, were analyzed by MANOVA. Change scores were significantly different from zero (F1,21= 125.22; p < .001), dose-related (F,,„ =21.76; p < .001) and time-related (F2,20=36.68; p < .001). Females felt more intoxicated than males (F,,,, = 4.59; p < .05), but there was no significant Sex by Dose interaction. Univariate analyses revealed that intoxication ratings were different from zero and followed a quadratic trend in all marijuana conditions.
Driving Performance
No driving tests had to be stopped for safety reasons by the driving instructors. Yet in two instances, both after the highest THC dose, the instructor felt compelled to intervene. In one case, the driving instructor twice warned the subject to avoid a screwdriver laying on the road but when he failed to react the instructor did by steering away from the object (it was immediately removed following this incident). The subject was queried about this situation after termination of the ride. He recalled that the driving instructor had taken control but did not recall why! In the other case, a subject failed to decelerate as he approached the turning point. The instructor told him to do so whereupon the subject abruptly brought the vehicle to a stop using the break.
SDLP reliability was high in this study: the correlation between measurements made on successive trials after placebo was 0.92 (p < .001). Correlations between SDLP values on the first and second trials after THC doses of 100, 200 and 300 Ag/kg were 0.90, 0.91 and 0.91 (all p<.001), respectively. This means that subjects' SDLPs from the second ride were almost perfectly related to those of the first, and, consequently, that SDLP measurement error was very small.

Mean values of SDLP are shown in Figure 6.2 as a function of Dose and Time. Higher values, indicating poorer road tracking performance, were found after marijuana smoking. MANOVA revealed that the Sex effect =4.41; p< .05) was significant, females having higher SDLPs than males. The Sex by Dose interaction, however, was not significant (F3,0=2.54; p<.09), indicating that the effect of marijuana was grossly the same for both sexes. The analysis indicated a clear Dose effect (F,,,,= 8.92; p <.001). Neither Time nor Dose by Time effects were statistically significant indicating that impairment after marijuana was the same in both trials. Separate dose comparisons revealed that performance after marijuana was always worse than after placebo (F1,22=7.45, 19.96 8z 14.58 for the 100, 200 8c. 300 tig/kg conditions, respectively; p< .012, .001 & .001; p= .05, .017 & .025).
Mean speed was very close to that established as the target by instructions and varied between conditions from 88.9 to 90.5 km/h (55.3 to 56.2 mph). Subjects drove 0.4 km/h (0.25 mph) faster after the 100 Ag/kg dose, and 0.4 km/h slower after both of the higher doses, than after placebo. Yet these differences were small as percentages of the average, and not significant. On average, speed was 0.6 km/h (0.37 mph) higher in the second than in the first ride resulting in a significant Time effect (F1,21=5.24; p < .04).
Differences in standard deviation of speed were greater between sexes than between conditions. There was a significant Sex effect (F1,21 = 6.99; p < .02), females having greater difficulty in maintaining a constant speed than males. SDSP was, after each THC dose, higher in the first, but lower in the second ride relative to placebo. Changes from placebo were, however, small and not significant.
Changes in standard deviations of steering wheel angle were small and not significant.
Perceived Driving Quality and Effort
Figures 6.3 and 6.4 respectively show mean perceived driving quality, and effort to accomplish the test, by Dose and Time. Subjects rated their driving performance as better than 'normal' after placebo. Ratings were around normal after the lowest THC dose but poorer than normal to about the same degrees after both of the higher doses. Differences attributable to Dose were significant (F3,19=3.76; p < .03). Separate dose comparisons showed that the effects of all three doses were significantly different from placebo (F122=4.80, 8.64 & 10.76 for the 100, 200 and 300 Ag/kg respectively; p < .04, .008 & .003; p=.05, .025 & .017). Perceived driving quality was higher in the second driving test than in the first = 8.06; p < .01), but the lack of a significant Dose by Time interaction indicated that this was independent of the administered dose.
Effort to accomplish the driving test increased systematically with the administered dose (Figure 6.4). Although there were only small differences in either SDLP or perceived driving quality between the two highest dose conditions, effort was, especially in the first trial, greater after the 300 than after the 200 tig/kg dose. This suggests that subjects had to compensate more after the highest dose to achieve about the same objective and subjective driving performance.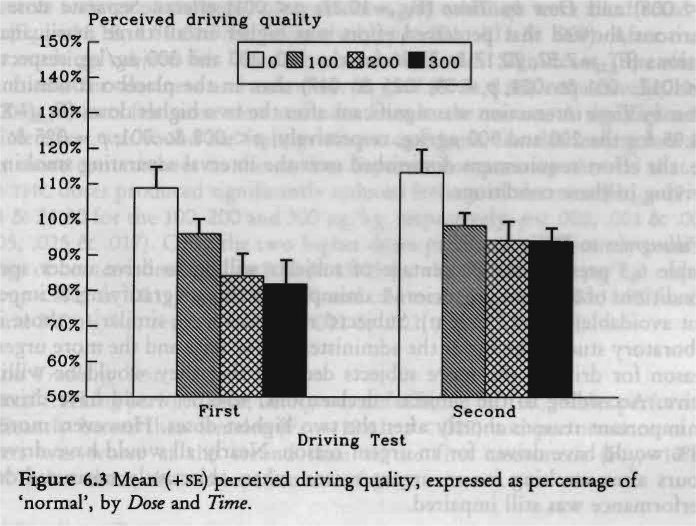
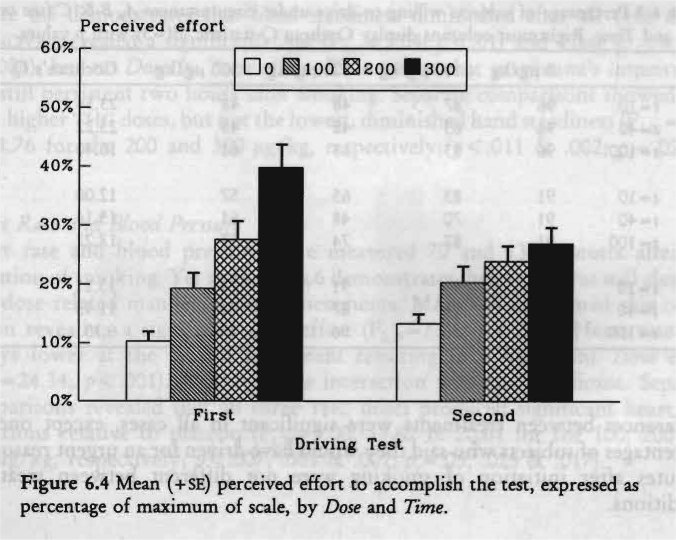
MANOVA revealed significant Dose (F3,19=13.41; p < .001), Time (F121=8.59; p < .008) and Dose by Time (F319=10.27; p<.001) effects. Separate dose comparisons showed that perceived effort was higher in all three marijuana conditions (F1,,=7.57, 20.17 & 37.96 for the 100, 200 and 300 Ag/kg, respectively; p < .012, .001 & .001; p,.=.05, .025 8E .017) than in the placebo condition. The Dose by Time interaction was significant after the two higher doses (F1,22= 8.45 & 24.95 for the 200 and 300 fig/kg, respectively; p < .008 8E .001; A =.025 8E .017); i.e. the effort requirement diminished over the interval separating smoking and driving in these conditions.
Willingness to Drive
Table 6.3 presents the percentage of subjects willing to drive under specified conditions of different urgencies (A. unimportant though gratifying; B. important but avoidable; and, C. urgent). Subjects' responses were similar to those in the laboratory study. The lower the administered THC dose and the more urgent the reason for driving, the more subjects declared that they would be willing to drive. According to the subjects' declarations, 40-60% would have driven for unimportant reasons shortly after the two highest doses. However, more than 75% would have driven for an urgent reason. Nearly all would have driven 11/2 hours after smoking for an urgent reason when objectively measured driving performance was still impaired.
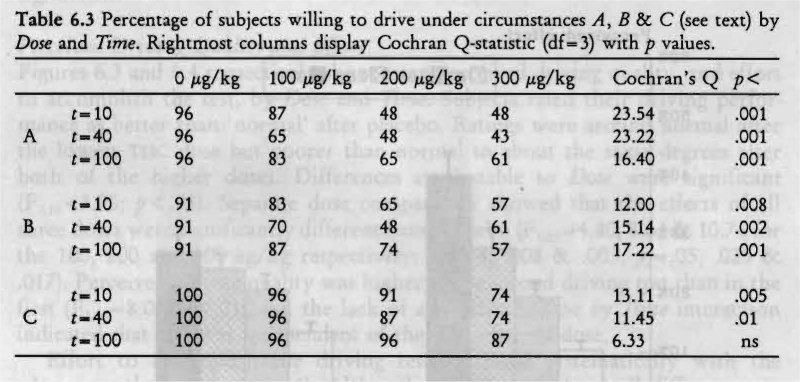
Differences between treatments were significant in all cases, except one: the percentages of subjects who said they would have driven for an urgent reason 100 minutes after initiation of smoking were not different between treatment conditions.
Perceived Alertness, Contentedness and Calmness
Subjective feelings of alertness, contentedness and calmness were all affected by Dose (F3,19 = 11.18, 4.86 8c 5.14, respectively; p<.001, .011 8c .009). After marijuana smoking, subjects felt less alert, content and calm. Significant Time effects were found for alertness and calmness (F220=7.89 & 8.10, respectively; both p< .003): subjects felt more alert and calm later in the session. A significant Sex by Time effect was found for feelings of contentedness, females feeling less and males more content later in the session. Separate comparisons showed that all three THC doses produced significantly reduced feelings of alertness (F1,,= = 12.46, 28.94 8c 24.80 for the 100, 200 and 300 Ag/kg, respectively; p< .002, .001 8c .001; pc= .05, .025 8c .017). Only the two higher doses produced significantly reduced feelings of contentedness (F1,22=8.70 8c 15.05 for the 200 and 300 Ag/kg, respectively; p <.007 8c .001; pc= .025 8c .017) and calmness (F1,22= 14.29 & 11.70 for the 200 and 300 itg/kg, respectively; p < .001 8c .002; pc= .017 8c .025).
Critical Tracking Test
Subjects' tracking performance, i.e. k, was not affected by THC. Males performed significantly better than females (F,,,, =12.61; p< .002) and performance of all subjects was worse at the second than at the first assessment (F,,,, =10.89; p< .003), but these observations are not of great concern.
Hand Steadiness Test
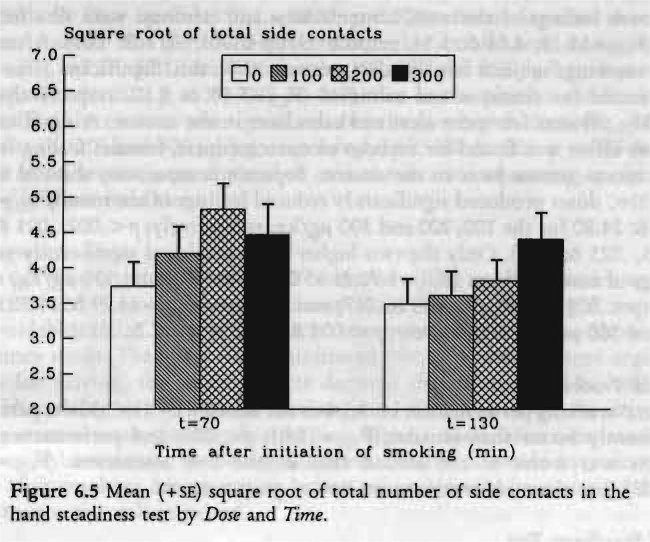
Figure 6.5 demonstrates that hand steadiness diminished after all THC doses. MANOVA revealed a significant Dose (F309=5.04; p< .01) and Time (F 8.61; p<.008), but no Dose by Time effect. This means that marijuana's impairment was still persistent two hours after smoking. Separate comparisons showed that both higher THC doses, but not the lowest, diminished hand steadiness (F1,27=7.67 8c 11.76 for the 200 and 300 itg/kg, respectively; p<.011 & .002; p,=.025 & .017).
Heart Rate and Blood Pressure
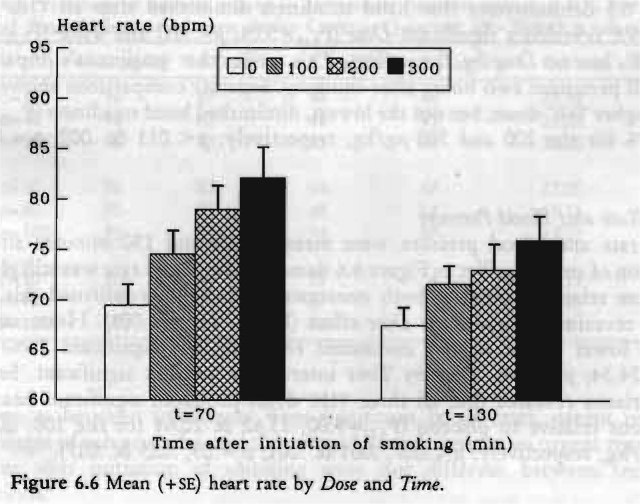
Heart rate and blood pressure were measured 70 and 130 minutes after the initiation of smoking. Yet as Figure 6.6 demonstrates, heart rate was still elevated in a dose related manner at both assessments. MANOVA confirmed this observation revealing a significant Dose effect (F,,,,= 7.71; p<.001). Heart rate was always lower at the second assessment resulting in a significant Time effect
=24.34; p< .001). Dose by Time interaction was not significant. Separate comparisons revealed that all three THC doses produced significant heart rate elevations relative to placebo (F1,22=9.00, 13.62 8c 20.61 for the 100, 200 and 300 Ag/kg, respectively; p<.007, .001 & .001; pc=.05, .025 & .017).
Systolic and diastolic blood pressure measurements were simultaneously analyzed in one 'doubly' repeated measures design. This means that both measures are analyzed in one multivariate design. Univariate effects of THC on systolic and diastolic pressures were only tested for significance, separately, if the multivariate Dose effect was significant. The lowest THC dose produced slightly lower blood pressure relative to placebo, whereas the highest dose had the opposite effect. Changes in blood pressures varied between -2.0 to +5.8 mmhg. MANOVA failed, however, to reveal either a significant Dose or Dose by Time effect. The only significant factor was Time (F1,21=6.92; p < .005), indicating that blood pressure decreased significantly from the first to the second assessment: this occurred in both the systolic (F11= 12.92; p< .002) and diastolic blood pressure (F11=4.77; p< .05).
Intra-Subject Relations between Variables
Table 6.4 shows the average intra-subject correlations of [mc], [nic-cooti], and SDLP with each of the other variables. The averages were computed from 23 intra-subject correlations, calculated from data obtained at eight sampling times (twice in each condition).
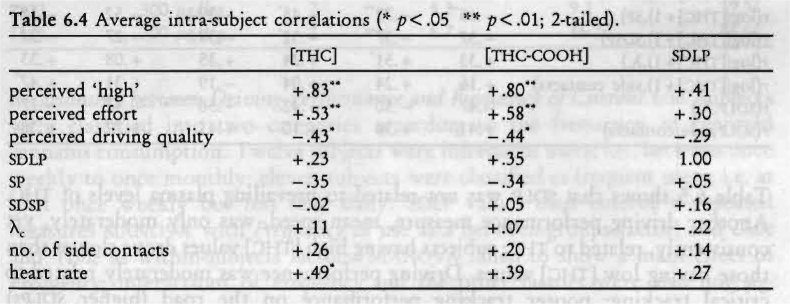
The table shows that higher plasma levels of the drug were associated with increased feelings of perceived 'high', higher levels of effort to accomplish the driving test, decreased ratings of subjective driving quality, and increased heart rate. There was no strong relationship, within subjects, between plasma levels of the drug and SDLP. This was because drug concentrations declined between the first and second sampling time, whereas SDLP scores hardly changed. When average intra-subject correlations were computed for the first and second sampling times separately, the correlations between [nic] and SDLP were 0.59 < .01) and 0.42 (p < .05), respectively.
Inter-Subject Relations between Variables
Relationship between Drug Levels and Performance. Inter-subject correlations between plasma concentrations of the drug and performance were calculated to determine whether subjects with higher plasma levels of the drug performed poorer than those that had lower plasma levels. Correlations between driving performance and performance in the laboratory were also calculated. The results are presented in Table 6.5. It appeared that correlations involving plasma concentrations were greater when logarithmic values of THC values were used in the computation (1 ng/ml was added to all THC values before the transformation in order to avoid negative log values). Correlations with THC-COOH were generally smaller than those with log THC values; therefore only correlations with log THC values are shown in the table.
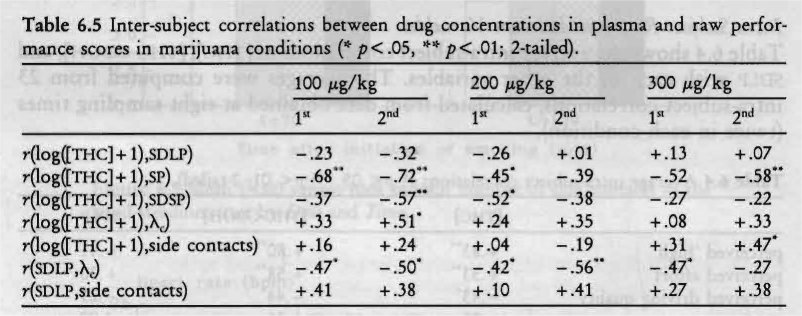
Table 6.5 shows that SDLP was not related to prevailing plasma levels of THC. Another driving performance measure, mean speed, was only moderately, yet consistently, related to THC; subjects having high [nic] values drove slower than those having low [nic] values. Driving performance was moderately related to critical tracking; poorer tracking performance on the road (higher SDLPs) concurred with poorer tracking performance in the laboratory (lower Xs).
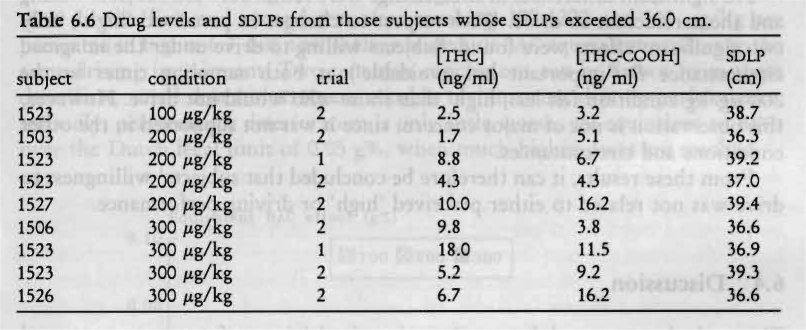
Five percent of the driving tests undertaken in this experiment yielded SDLP scores above the normal limit of 35 cm (Table 6.6). This limit was established by several hundred young and middle-aged volunteers and psychiatric patients who uniformly failed to achieve higher scores in the same test after being treated with placebo in all of the Institute's studies since 1986. It is illuminating to examine the present drivers who drove over the limit with respect to their prior treatments and the plasma concentrations of THC and its metabolite they exhibited at these times.
These data are important in two respects. Aberrant driving performance never occurred after placebo smoking, only once after the lowest THC dose and with equal frequency (4x) after both of the higher doses. Moreover, aberrant driving generally occurred during the second and not the first ride in direct opposition to the trend in plasma THC concentrations. From this, it's easy to infer the futility of predicting changes in SDLP, and presumably other aspects of driving performance, from a single [Thic] estimation.
Correlations were also computed between drug plasma concentrations and changes in driving performance from placebo to marijuana conditions. These correlations were generally smaller than those involving the raw scores. Thus, [nic] does not predict changes in that performance.
Relationship between Driving Performance and Frequency of Current Use. Subjects were classified into two categories according to the frequency of reported cannabis consumption. Twelve subjects were infrequent users; i.e., between once weekly to once monthly; eleven subjects were classified as frequent users; i.e. at least once weekly but less than daily. SDLP values then entered a repeated measures MANOVA with Frequency of use as a between-groups factor, and Dose and Time as within-subjects factors. MANOVA failed to show a main effect of Frequency; interactions of Frequency and the other factors were also not significant.
Relation between Driving Performance and Driving under the Influence Experience. Subjects were classified into two categories according to the frequency of reported driving within one hour of cannabis consumption (see Table 5.1). SDLP values then entered a repeated measures MANOVA with Experience as a between-groups factor, and Dose and Time as within-subjects factors. Neither Experience nor any interaction was significant.
Relation of Willingness to Drive to Perceived 'high' and Driving Performance. The relationship between willingness to drive and changes in SDLP and perceived 'high' was determined as follows. Groups were defined by their willingness to drive; i.e., two groups were defined comprising those subjects who would not have driven and those who would, for each combination of condition (4x), sampling time (2x) and urgency of circumstance (3x), separately. Student's 2-tailed t-test for independent means was employed to determine whether the groups had significantly different change scores (drug minus placebo) of SDLP and perceived 'high'. Thus, 18 different t-test were performed for each variable, SDLP and perceived 'high'. Criterion for statistical significance was set at .01 because of the large number of tests.
No significant differences in SDLP change were found between subjects willing and those reluctant to drive. With respect to changes in perceived 'high', only two significant effects were found. Subjects willing to drive under the imagined circumstance B ('important but avoidable') at both sampling times in the 200 Ag/kg condition felt less 'high' than those who would not drive. However, this observation is not of major concern, since it was not supported in the other conditions and circumstances.
From these results, it can therefore be concluded that subjects' willingness to drive was not related to either perceived 'high' or driving performance.
6.4 Discussion
This study demonstrated that marijuana impairs driving performance as measured by an increase in SDLP; all three THC doses significantly affected SDLP relative to placebo. It is remarkable that driving impairment was about the same after the two higher doses. This cannot be due to a ceiling effect, since greater deterioration in road tracking performance has been found after many prescription drugs (e.g. Robbe et al., 1989) and also high doses of alcohol (Louwerens et al., 1987) . One possible explanation for the lack of a clear dose related impairment may be that subjects were able to mitigate the effects of the highest dose by 'trying harder'. Indeed, subjects reported putting more effort in performing the test after smoking the highest THC dose. In other words, subjects tried to overcome the perceived disparity between their actual state and the one required to drive the car efficiently; the higher the THC dose, the greater the disparity between the actual and required states, and the harder they tried to compensate for it.
Though marijuana's adverse effects on SDLP were somewhat smaller in the second test than in the first, no significant interaction was found between the treatments and repetition of the test. This means that the driving performance decrement after smoking marijuana persisted almost undiminished for two hours after smoking.
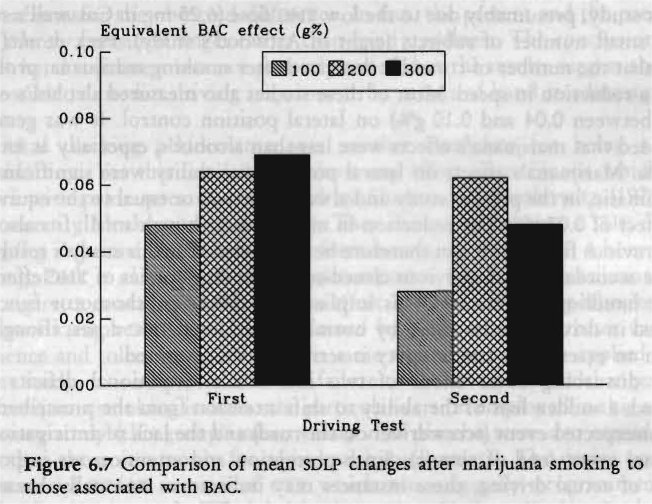
What is the practical relevance of the size of the effects of marijuana upon lateral position variability? This can be inferred by comparing marijuana's effects to those of alcohol in the same test. As cited above, Louwerens et al. (1985, 1987) conducted a study to establish the dose-effect relationship of alcohol. Their study resembled the present one in many aspects: they applied exactly the same driving test, the study was performed on a closed road, and involved the participation of 12 male and 12 female volunteers. They were able to derive an empirical equation for predicting the change in SDLP from placebo levels with increasing blood alcohol concentrations. Mean SDLP began to change significantly at blood alcohol concentration of 0.03 g% and increases exponentially to the point where the vehicle's lateral motion can no longer be restricted to within lane boundaries (at about BAC=0.12-0.15 g%, on the average). Elevations of the group's mean SDLP in the first and second test after smoking 100, 200 and 300 itg/kg are presented in Figure 6.7, but now as their respective BAC equivalent producing the same driving impairment. Two tentative conclusions can be drawn from these data: first, small doses of THC are capable of impairing driving performance; secondly, performance deterioration is only little worse, yet equivalent to BACs over the Dutch legal limit of 0.05 g%, when much higher doses are smoked.
As mentioned above, mean SDLP values did not change greatly over time. The same can be said of mean subjective driving quality ratings. Yet other parameters did change over time; THC in plasma, perceived 'high', heart rate elevation and perceived effort to accomplish the driving test were all less in the second test than in the first. Another important observation was made when the 5% highest SDLPs were examined in greater detail. Nearly all of these scores were recorded in the second rather than the first driving test after smoking higher THC doses. It may be that subjects did not try to compensate as much during the second ride because they felt less intoxicated. Whatever the reason, these results clearly indicate that the behaviorally toxic effect of THC had not yet dissipated. This means that 'behavioral intoxication' may outlast physiological and subjective marijuana intoxication, a phenomenon already reported by other investigators (e.g. Reeve et al., 1983; Yesavage et al., 1985). On the other hand, subjects' perceived driving performance, measured retrospectively, did not change from the first to the second test when compared to placebo. Thus, while they felt less intoxicated in the second test they realized that their driving impairment was still the same as in the first test. Subjective feelings of 'high' should therefore not be equated with subjective feelings of impairment, as is often done.
Some investigators (Klonoff, 1974; Hansteen et al., 1976) found that marijuana impairs lateral position control as measured by number of cones hit in slalom tests. Others (Casswell, 1979; Attwood et aL, 1981) did not find any effect of marijuana upon lateral position control as measured in a similar way as in the present study, presumably due to the low THC dose (6.25 mg in Casswell's study) or the small number of subjects (eight in Attwood's study). Peck et al. (1986) found that the number of cones hit decreased after smoking marijuana, probably due to a reduction in speed. Most of these studies also measured alcohol's effects (BAcs between 0.04 and 0.10 g%) on lateral position control. It was generally concluded that marijuana's effects were less than alcohol's, especially at BAGS of 0.08 g%. Marijuana's effects on lateral position variability were significant, yet not dramatic, in the present study and always less than or equal to the equivalent BAG effect of 0.07 g%. The reduction in mean speed, though small, fits also well with previous findings. It can therefore be concluded that this study's results are in close accordance with previous closed-course driving studies of THc effects on vehicle handling parameters. This implies that simple psychomotor functions involved in driving are impaired by normally consumed THC doses, though not to such an extent that traffic safety is seriously compromised.
Yet disturbing observations of two individuals' attentional deficits were observed; a sudden loss of the ability to shift attention from the prescribed task to an unexpected event (screwdriver on the road) and the lack of anticipation for a normal event (end of circuit). Since perception and attention are important aspects of actual driving, these instances may indicate an unusually hazardous property of THC when the drug is consumed shortly before operating a vehicle. Therefore, the revised conclusion must be: what was measured was only moderately affected by THC, but another major deficit may have existed after the highest dose which bears further examination. One can not conclude whether the standard driving test applied in this study measures the most important deficits.
Important practical implications of the study are whether driving performance decrements can be predicted by prevailing plasma concentrations of the drug.
Though average [Thic] and [Thic-cooH] values were clearly dose-related, driving impairment reached a ceiling before the highest concentrations were achieved. Inter-subject correlations between plasma concentrations of the drug and driving performance after every dose were essentially nil, partly due to the peculiar kinetics of THC. It enters the brain relatively rapidly, although with a perceptible delay relative to plasma concentrations. Once there, it remains even at a time when plasma concentrations approach or reach zero. The conclusion is that driving impairment cannot be predicted by prevailing plasma concentrations of THC or THC-COOH.
Another way of predicting driving impairment was explored; namely, by performance in laboratory tests that might be potential 'roadside' tests. Hand steadiness was impaired by marijuana after high doses but not after 100 Ag/kg. Performance in this test was not related to driving performance. Previous studies employing the same test (Clark et al., 1970; Milstein et al., 1975) showed greater sensitivity to marijuana-induced impairment of hand steadiness. In those studies subjects were not allowed to rest their hands on the table, which is probably the major reason for the observed difference. In fact, the present and the preceding study merely measured finger rather than hand steadiness. The conclusion must be that hand steadiness was not properly tested, but the results suggest that it is not possible to predict driving impairment by means of hand steadiness performance.
Critical tracking performance was another candidate for being a good 'roadside' test. Yet this test failed to show any effect of marijuana which is in conflict with prior research conducted by Sharma and Moskowitz (1975) and more recently Moskowitz et al. (1981). They demonstrated that a TI-IC dose of 200 tig/kg impairs critical tracking performance for at least up to 4 hours post-smoking. Peck et al. (1986), however, also reported a failure of marijuana alone (1.0 g cigarette containing 1.9% THc) to affect X. scores. They hypothesized that their conflicting results could be explained by their subjects' greater cannabis experience and tolerance. Although the same argument could be applied in the present study, it is suspected that the failure to detect significant changes in X, after marijuana smoking is due to the particular version employed in this and the laboratory study (this group's mean values after placebo were also considerably lower than those commonly found in healthy volunteers). The device used was a commercial PC/AT version of CTT which was originally programmed on a Commodore-64 computer. The latter has been successfully applied in psychopharmacological research by the authors and their colleagues and hitherto appeared as a very sensitive test for drug-related impairment (e.g. Robbe et al., 1989; Ramaekers et al., 1992a). This study was the first in which the commercial PC/AT version was employed, so the conclusion that the software or hardware was not well designed seems inevitable.
All subjects were willing to undertake the driving tests. But test conditions were artificial and the same individuals may or may not have been willing to drive under normal circumstances. Therefore, one questionnaire inquired into the subject's willingness to drive an automobile when experiencing the same drug effect under 'normal' conditions. Subjects' willingness to drive was related both to consumed THC dose and urgency. After smoking a low THC dose, nearly all were willing to drive, especially for urgent reasons. After higher doses, fewer were willing to drive under all circumstances. According to what subjects said, they did not become less cautious after inhaling increasingly large doses (unlike what is often reported about alcohol). On the contrary, their caution increased with intoxication. Still, 50% of the subjects reported that they would have driven for an unimportant reason shortly after smoking the two highest THC doses. Since willingness to drive was not related to objective driving impairment, it may be concluded that at least some of the subjects either were not able to appraise their driving performance before they had actually driven or did not consider their impairment as critical.
It is interesting to compare plasma concentrations of THC found after smoking the highest THC dose in this study with those found in the laboratory study. The highest dose administered in the present study was comparable to the average dose the same subjects consumed in the laboratory study. Mean plasma concentrations of THC after the highest dose in the present study, determined 30 and 90 minutes after initiation of smoking, were 50 and 40% higher than those measured in the laboratory study after 40 and 100 minutes. This large difference can only be partially explained by the 10 minutes delay between the two studies' blood sampling schedule. Apparently, subjects smoked more efficiently in this than the previous study. Since most volunteers were used to smoking hashish instead of marijuana, the increased efficiency compared to that in the laboratory study may be explained by familiarization with the particular formulation of the drug.
One of the objectives of this study was to determine whether or not the same experimental conditions could be implemented in a study on marijuana's effects on driving on a primary highway public for other traffic. All subjects were willing and able to finish the driving tests without great difficulty. In cases of the exceptional events, the driving instructor was able to control the situation, safely. The effects of marijuana on SDLP were never so large as after many other drugs that had been safely studied in the presence of other traffic. Furthermore, it can be inferred from what subjects said and did that they would not be expected to seek dangerous situations and would be responsive to the instructor's advice. Normal safeguards were deemed sufficient to ensure safety. Hence, the final conclusion was that it would be safe to repeat this study on a normal highway in the presence of other traffic.
| < Prev | Next > |
|---|


