Report 2 Cannabis
| Reports - A Report on Global Illicit Drugs Markets 1998-2007 |
Drug Abuse
3 Cannabis
There is a growing literature on the size of retail cannabis markets in particular countries and/or regions. Most studies either
provide expenditure estimates for a specific country (micro approach) or for different regions of the world (macro approach).
Each study relies on idiosyncratic assumptions, which has led to wildly different estimates of the size of this market even
within the same country. This section uses a demand-side model that makes it easy to combine micro and macro approaches
to produce country- or region-specific estimates with readily available prevalence and price data. While this approach is not
without its own limitations and caveats, it can be broadly and consistently applied to most countries and hence should help
advance our understanding of the size of world cannabis market.
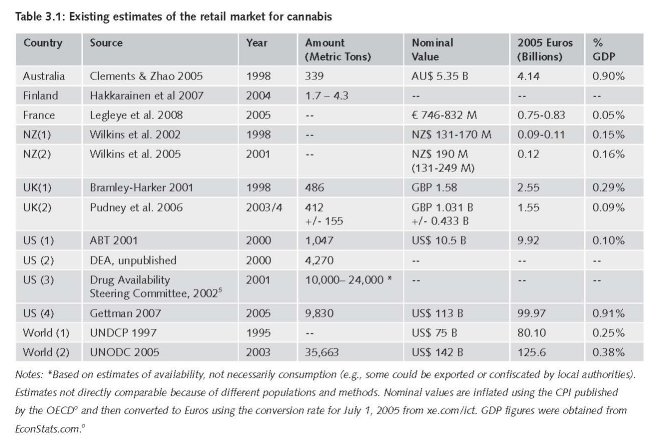
Table 3.1 presents the published retail cannabis market estimates for individual countries and the world. Since each study
employs different assumptions and methodologies, extreme caution should be used when making comparisons. The UNODC
(2005) estimates that the world retail market for cannabis was about €125 Billion4 circa 2003; more than the retail markets
for cocaine and opiates combined. The US is believed to be the largest contributor to this estimate, but the exact size of that
market is far from settled. Indeed, some of the estimates of the US market vary by a factor of 10.
The UNODC’s macro estimates indicate that North America and Western/Central Europe account for 45% and 28% of the
world cannabis market, respectively. The UNODC’s input-output model suggests that each past year user in North America
consumed 165 grams of cannabis herb at almost €10 per gram. With approximately 25 million past-year users in the US
during this time, the UNODC calculations imply that retail cannabis expenditures in the US exceeded €40 billion. This is more
than four times the retail estimate generated by the White House’s Office of National Drug Control Policy for 2000. There
are obvious differences in the methodologies employed by the ABT and UNODC (e.g., the former focused on past-month
users and the latter focused on past-year users), but the large discrepancies raise important questions about how to generate
reliable market estimates. This particular discrepancy is especially disturbing since we know more about drug use patterns
and markets in the US than in most countries. While Abt suggests that its estimate may be low and the UNODC suggests
the error in their estimate could be significant, it is important to note that neither source provides a range for their estimates.
Thus, it is difficult to know how much confidence one should place on either of these point estimates.
3.1 Calculating total consumption of cannabis
We begin with a simple formula for calculating the number of grams consumed in country (c):
(1) TotalGramsc = Σ
u Userscu * UseDaysu * GramsPerUseDayu ,
Where u denotes the type of user. In the model, we consider consumption separately for two different types of users: recent
users who report use in the past month and users who report use in the past year but not in the past month. There are two
reasons for distinguishing consumption between these two groups: 1) To better reflect the fact that heavy users of cannabis
may consume cannabis far more frequently and/or in higher doses than individuals who do not use cannabis regularly, and
2) Most countries collect data for these two groups.. Total consumption, therefore, is constructed as the sum of user-specific
amounts consumed in a given year. The amount consumed, in turn, is the product of the number of days in which the drug
was reportedly consumed, the typical amount consumed on those days, and the number of users who fall into a specific
user-group category. We now consider the estimation of each of these in turn.
3.1.1 Number of users
Most developed countries regularly collect and report information on past year and past month consumption from surveys
conducted of their household populations. This information is used to create two mutually exclusive user types (u): 1) User
in the past month and 2) User in the past year but not in past month. These figures, along with retail prices which will be
discussed shortly, are reported in Table 3.2.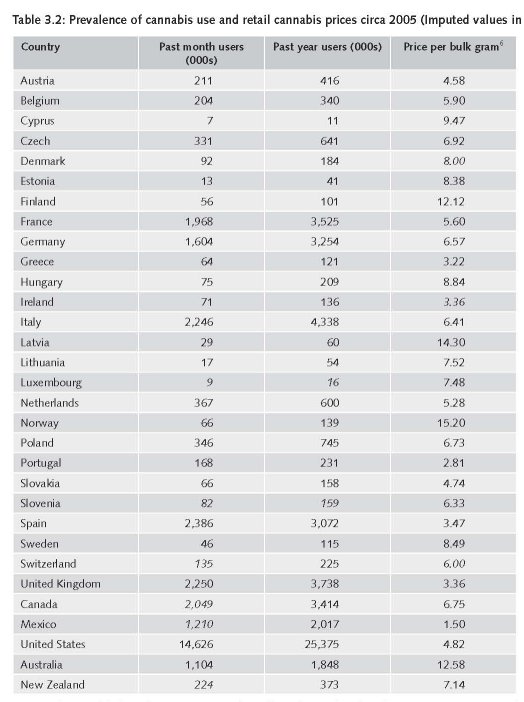
Notes: Unless noted below, all European price and prevalence data are based on the EMCDDA’s 2007 Statistical Bulletin. For the UK, the
EMCDDA specifies whether the estimate is for England & Wales, Northern Ireland, or Scotland. For 2004, this figure is reported for the
United Kingdom. The prevalence rate is multiplied by 2005 population aged 15-64 except in these instances: Czech Republic (18-64),
Denmark (16-64), Germany (18-59), Hungary (18-54), Malta (18-64), Poland (16-64), and Sweden (16-64). Swiss prevalence is for those
15-64 in 2002 (Drewe et al., 2004). Sources for the number of users outside of Europe: Australia (14+, 2004; Australian Institute on Health
and Welfare), Canada (15+, 2004; Canadian Addiction Survey), Mexico (15-64, 2005; UNODC 2007), New Zealand (13-64, 2005/2006;
Slack et al. 2008), and US (12+, 2005; NHSDA 2005). Missing price data was imputed based on neighbouring countries: Switzerland
(geometric mean7 of France, Germany, and Italy), Denmark (geometric mean of Germany and Sweden), and Ireland (UK). Missing prevalence
data was also imputed based on neighbouring countries: Luxembourg (Belgium) and Slovenia (Italy). Past month prevalence was not available
for Switzerland, Mexico, New Zealand, and Canada. In these cases we multiplied the annual prevalence rate by 60%, which is close to
what we saw for many of the other countries.
3.1.2 Number of use days
Information from a variety of surveys suggests that the average number of days in which cannabis is consumed is fairly similar
across developed countries. Rigter & van Laar (2002) find that the frequency of past month cannabis consumption in the
Netherlands compares well with the US and footnote that “Roughly similar frequency distributions have been reported for
Australia, France, and Germany” (29). Cannabis users in the US and Australia also appear to have similar number of use days
in the past year. A detailed frequency distribution based on the 2004 Australian household survey yields a mean number of
consumption days for past year users to be 87 to 98 days, depending on whether one assumes weekly but non-daily users use
2 or 3 times a week.8 Micro data analysis of past-year users in the 2005 US household survey suggests the average number
of use days reported in the household survey is 98.8 days.
While there are clearly similarities across countries in the frequency of cannabis use, there are also clearly differences in terms
of the time frame in which cannabis use is measured across countries. In an attempt to make the estimates more consistent
we make use of US data which provides detailed information regarding the frequency of use by types of user groups. In light
of the aforementioned similarities across countries, the reliance on US data for identifying the number of days used in the past
year among each user group should introduce only a small amount of measurement error into the model. Table 3.3 presents
the median and mean estimates of the number of days in which cannabis is used for the two user groups using data from
the 2005 National Survey on Drug Use or Health (NSDUH).

Given the potential bias that could be introduced by relying on information from a household population for an illegal activity,
it is important to consider how similar these estimates are to those obtained from other relevant populations. Surprisingly,
these past-month use day estimates are indeed similar to those derived from a national sample of arrestees in the United
States. Approximately 10,000 male arrestees in the most recent ADAM survey (2003) reported using cannabis in the month
before arrest, with a median and mean equal to 10 and 13.5 days, respectively. If we assume that past month consumption
is consistent with use in the previous 11 months, we can generate estimates of past year use days that are reasonably similar
to what is derived from the household population (For arrestees: Median = 120 days; Mean = 162 days).
England conducts a similar arrestee survey, and like the US ADAM program, it includes voluntary drug tests. An analysis of
these data published by the US National Institute of Justice (the research arm of the Department of Justice) found that after
controlling for a host of demographic and criminal offense variables, there was no statistically significant country difference in
the rate of positive tests for cannabis (n = 4,833; Taylor & Bennett, 1999). Since a urinalysis for cannabis can either identify
recent users or heavy users who recently quit, we cannot definitively state that the levels of cannabis use are similar among
arrestees in the US and England. However, this is consistent with the household survey data indicating that quantity consumed
among past month users is fairly similar for the US and other Western developed countries.
3.1.3 Quantity consumed per use day
The lack of information about typical quantities consumed on a use day (for cannabis and other drugs) severely limits the
accuracy of demand-side estimates. Not only is this information hard to find, differences in consumption patterns make
international comparisons difficult (e.g., joints vs. bongs, resin vs. herbal, with or without tobacco). For lack of better information,
Pudney et al.’s UK market estimates (2006) rely on daily consumption estimates from an Australian household survey.
For those who used cannabis >= 3 times in the previous week, Pudney et al. assumed that the mean quantity used per day of
use was 1.2 grams +/- 0.4 for individuals consuming cannabis in the UK. For everyone else in the UK, the quantity assumed
was 0.55 grams +/- 0.4. Similarly, Bouchard (2008) uses Pudney et al.’s (2006) figures to estimate the size of the cannabis
retail market in Quebec. The need to draw on estimates from Australian data to predict market estimates for the UK and
part of Canada demonstrates the dearth of country-specific information even in countries that have relatively developed
monitoring systems.
Before 1995, the National Household Survey on Drug Abuse (NHSDA) in the United States asked past-month marijuana
smokers how many joints they consumed on a typical day. In the 1994 NHSDA the average was 2.5 (95% confidence interval
1.91 and 3.09). To compare this to the figures used by Pudney et al. (2006), we must make an assumption regarding the
consistency in amount consumed over time as well as an assumption about the average amount of marijuana in a typical joint.
No data exist from which to assess the appropriateness of the first assumption (regarding consistency in amount consumed
per use day), so it will just be assumed from illustrative purposes. Data do exist for considering the assumptions regarding
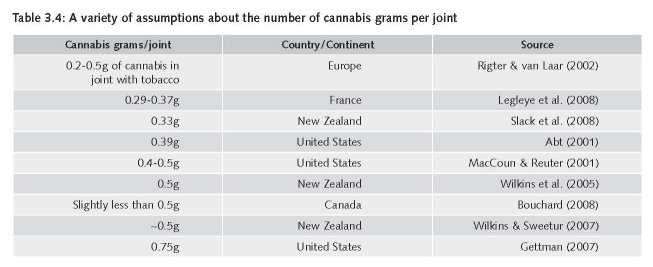
average amount of marijuana in a typical joint. Table 2.4 highlights a variety of estimates of marijuana grams per joint for
different countries, with many of the estimates hovering between 0.3 and 0.5 grams per joint. Rigter and van Laar’s (2002)
review of cannabis consumption in Europe note: “The corresponding number of ‘units of use’ depends on the manner of
consumption, users’ preferences, and the type, origin and perhaps strength of the cannabis. When smoked with tobacco, for
instance, one gram may be processed into two to five joints”; thus suggesting 0.2 to 0.5 grams per joint in Europe. This is
consistent with a more recent estimate from France (0.29-0.37g; Legleye et al., 2008).
Using the joints per day range from the U.S. and reasonable range about the grams of cannabis per joint from the international
literature, we generate figures that are consistent with Pudney et al. (2006). Using 0.4 grams as our best estimate, this
suggests that past-month users consumed about 1 gram of marijuana a day (2.5 joints * 0.4 grams). We would expect this
figure to be somewhat smaller than Pudney et al.’s estimate for intensive users (1.2 grams) since they focus on the far right
tail of the distribution (>=3 times in the previous week). We are most comfortable using 0.3 grams and 0.5 grams as our low
and high estimates, which gives us a range 0.57 grams (1.91 joints * 0.3 grams) and 1.55 grams (3.09 joints * 0.5 grams).
Since we do not have grams per joint estimates for non-monthly users, we simply divide the number of joints by two.
Although arbitrary, it is important to note that this is an inconsequential assumption as past month users account for the
vast majority of consumption and expenditures. It also generates a range (~0.3-0.9g) that is consistent with Pudney et al
(0.15-0.95g).
While much of the previous discussion focused on joints, this does not mean that we are excluding consumption via other
mechanisms (e.g., bongs, pipes, blunts, one-hitters). Our estimates of the number of users, type of users, and number of use
days are independent of the delivery mechanism. Further, the consumption estimates used by Pundey et al. (2006) were not
specific to joints. Ultimately the main focus on grams consumed, but we do examine the joint consumption distribution since
is the only information we have to help us develop 95% confidence intervals.
3.1.4 Underreporting
Table 2.1 suggests that nearly 40% of the young marijuana users in the household population lied about their use. This is
higher than most figures in the literature and so we consider this our upper bound. For the lower bound we assume no underreporting
(0%) and for the best estimate we assume 20%. This is not only conveniently the midpoint between these bounds,
but also consistent with other estimates: Fendrich et al.’s (2004) household survey in Chicago suggests 78% of cannabis users
were honest, and this is similar to the 82% calculated for adult male arrestees in 2003 (Table 2.1). This adjustment assumes
that underreporting is not correlated with intensity of use.
3.1.5 Assessing the face validity of these consumption assumptions
Table 2.5 summarizes the information used in the construction of each country’s estimate of total consumption of cannabis.
The goal here is to make explicit where assumptions have to be made for the construction of an estimate, so that these
assumptions can be tested when new information and data become available.
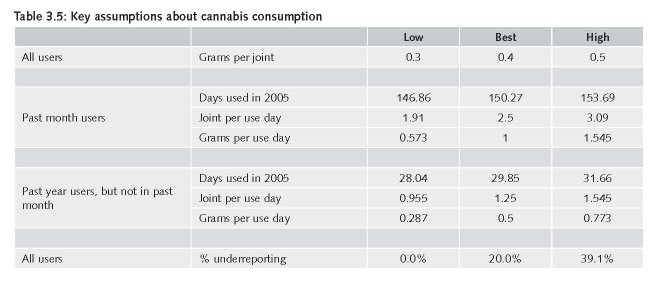
The assumptions yield results that are consistent with the existing literature. The expected number of grams any past month
user would consume in a year would be 150.3 days * 2.5 joints * 0.4 grams = 150.3 grams. A similar calculation for those
who used in the past year but not the past month yields 29.9 days * 1.25 joints * 0.4 grams = 15 grams. Table 2.2 suggests
that approximately 60% of past-year cannabis users used in the previous month in the US, Australia, and Western/Central
Europe. Using a weighted average of the annual consumption for these two types of users (past month; past year but not
past month), we estimate that the average number of grams consumed for any past year user in one of these countries (US,
Australia and Western/Central Europe) would be 0.6 * 150.3 + 0.4 * 15 = 96.2 grams. This figure is consistent with the “100
grams-per-user benchmark” suggested by Bouchard (2007). Bouchard calculates that past year users in Quebec, on average,
used 94 grams in 2003 and notes that this is consistent with studies from other countries (e.g., Pudney et al., 2006; Childress,
1994). Additionally, this is also consistent with data from New Zealand which suggests an average annual consumption to be
98 grams per user (89.3 occasions * 1.1. grams per occasion; Slack et al., 2008). These similarities are surprising considering
the variety of sources and countries used to inform the input parameters. They also provide some reassurance that at least
for developed countries the assumptions being imposed in this model are not unreasonable.
3.2 Calculating total retail expenditure
Once an estimate of total consumption is produced for each country, an estimate of the expenditure in the retail market
for each country (c) can be constructed by multiplying total consumption by the average price per gram. Eq. 2 presents a
mathematical model for calculating the total amount spent on cannabis in the retail market:
(2) Expendituresc = TotalGramsc * PricePerGramc.
This simple formula masks two important and interrelated complexities in cannabis markets: Quantity discounts and the
importance of gifts. Most cannabis users do not pay for their cannabis and those who buy in bulk receive discounts (Wilkins
et al., 2005; Caulkins & Pacula, 2006).9 These two factors can complicate the calculation of total expenditures considerably. If
the goal is to try to estimate the value of cannabis consumed, a value must be placed on the free cannabis. In some instances,
this is not difficult because the value of the last transaction is a reasonable proxy. For example, if person A buys a gram for €6
and shares it equally with person B, the value of the free cannabis given to B is €3.10 Even though person B did not actually
spend money on the cannabis, information of the last transaction in which the cannabis was purchased provides information
on the value of the cannabis consumed. However, if person A instead bought in bulk (e.g., an ounce instead of a gram), then
the average price paid per gram would likely be substantially lower due to quantity discounts than if he bought only one gram.
If this person sells part of their ounce and gifts another portion, then using the full amount of this one transaction might lead
to double counting (at least for the portion that gets resold). To obtain the ideal estimate of average price paid per gram, one
would want to only consider those transactions for which the consumers purchased it for their own consumption or gifted it
to others (no resale). Unfortunately, it is only possible to get this sort of detailed information regarding what purchasers did
with the amount they purchased in a few countries.
As with the prevalence estimates, the European price data are derived from the EMCDDA’s Statistical Bulletin 2007 (EMCDDA,
2007a). Average price data are available for both cannabis herb and cannabis resin, but prevalence estimates do not distinguish
between the two. The UNODC reports almost similar amounts of herb and resin were available for consumption in
Western and Central Europe in 2003 (3.16M and 2.89M kg cannabis equivalents, respectively); thus we simply take the
geometric mean of the mean estimates. If a country reports only one value for herb and resin, we calculate the geometric
mean of these two values. If the high and low estimates are reported for both types (and no mean), the geometric mean is
based on these four values.
The price data for other countries come from a variety of sources.11 For the United States, our analyses of the 2005 NSDUH
(the only nationally representative price estimate available for the U.S.) suggest that the average price paid per gram for all
purchases by non sellers up to one pound was €4.82.12 Wilkins et al. (2005) perform a relatively similar calculation for New
Zealand and generate an average price paid per gram of €7.14. Although their figure may include dealers who presumably get
larger quantity discounts (thus deflating these estimates), this figure is consistent with other retail estimates for New Zealand.13
The Australian price data are based on findings from the 2006 Illicit Drug Reporting System (O’Brien et al., 2006). The lack of
retail price information for Canada required using information from the UNODC’s ARQ: €6.75 per gram. While this estimate is
generally consistent with the impressions of a Canadian cannabis scholar (M. Bouchard, personal communication), we would
much prefer to generate price estimates from micro data or statistics from micro data as opposed to a single response to an
administrative survey.
Data on the price of retail cannabis in Mexico are not readily available, but the UNODC does report a wholesale price per
kilogram equal to €66. This is lower than the wholesale ranges provided for neighbouring Belize (€104-€167) and Guatemala
(€91-€96) in 2005. The UNODC also provides ranges for the retail price of one gram in Belize and Guatemala, and for lack
of better information, we take the geometric mean of these values to calculate a value for Mexico (which will likely be an
overestimate of the retail price in Mexico). Doing so yields a price per gram equal to €1.50.
There are at least two major caveats that need to be kept in mind when comparing cannabis prices across countries. First, it is
unclear to what extent these prices approximate actual retail-level prices per gram. Given the relative scarcity of information
on drug prices in most countries, it is unclear whether the price estimates reported to the EMCDDA and other organizations
exclude purchases made by drug sellers. Second, these prices are not explicitly adjusted for potency. For retail expenditure
estimates, the number of raw grams consumed in a country is multiplied by the average retail price paid per gram for the
entire country. In theory, this average is a weighted average of the prices paid for high-, typical-, and low-quality cannabis,
and accounts for within-country differences in price. But whether or not the prices reported actually reflect these differences
for each country is an empirical question. Future data collection efforts will hopefully consider these factors when collecting
and reporting information for the price of cannabis.
Table 3.2 presents the price estimates used to generate our expenditure estimates. There is large variation in prices as well as
in the ratio of past month to past year users. While one might be tempted to draw comparisons regarding the relative price
per gram of cannabis across countries, the reader is reminded that no adjustments are made for the prevalence of quantity
discounts reflected in the data or the average potency of the cannabis consumed. Thus, it would be unwise to make direct
comparisons. However, one would expect that the average potency of cannabis within specific regions (e.g. Europe) to be
less variable then across regions (e.g. Europe versus Australia or the North American). Nonetheless we still see substantial
variation in the average price paid per gram. For example, in the Scandinavian countries the average price is highly variable,
as indicated by an average price per gram in Sweden of €8.49 and an average price per gram in Norway of €15.20. This
variation might reflect differences in the typical purchases made to obtain information on the price of cannabis within these
countries, or differences in the quality (potency) of the typical purchase made within these countries.
3.3 Results
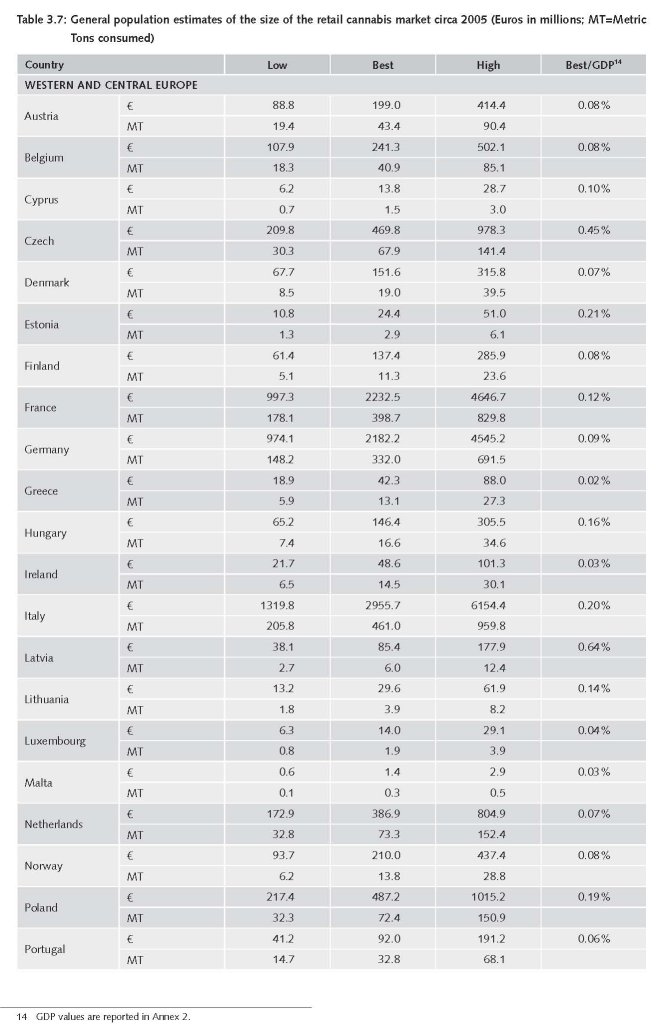
To generate country- and regional-level estimates of the retail cannabis market, we use a simple spreadsheet model and
populate it with the data from Tables 3.2 and 3.5 and apply the aforementioned assumptions about quantity consumed and
expenditures. For each country, we generate a best, low, and high estimate of the total grams consumed and total amount
spent on cannabis at the retail level in 2005. Recall that we do not vary the price within countries since we are, in essence,
using a weighted average of the prices paid for high-, typical-, and low-quality cannabis when using the average price.
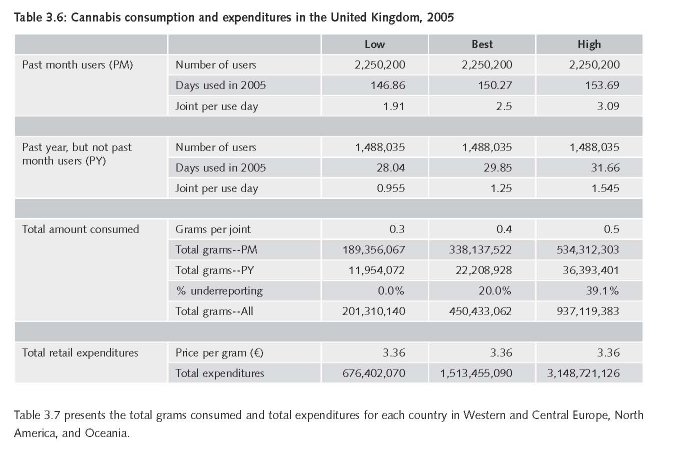
Table 3.6 presents an example of the model using the United Kingdom as an example. In our best estimate for the UK,
the share of total grams consumed that are attributable to those who used in the past year but not the past month is only
6 percent.
3.4 Discussion
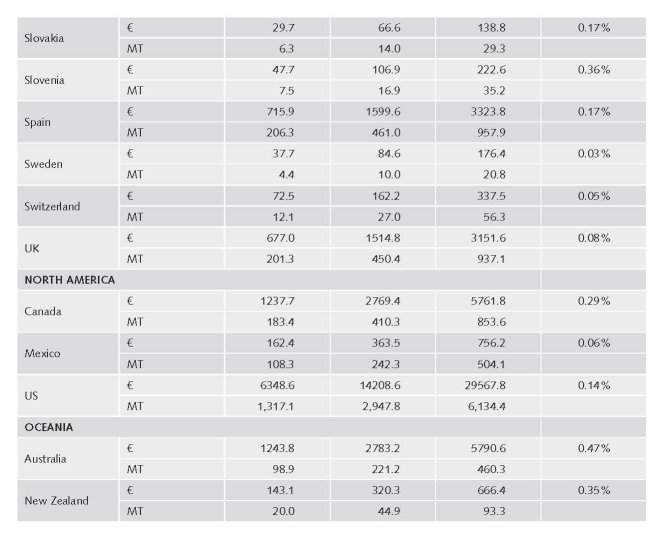
Although this table focuses on 2005 and most of the market studies listed in Table 3.1 cover different years, there are some
noteworthy similarities. Pudney et al. (2006) estimate the total number of grams consumed in the UK circa 2004 is 412 MT
+/- 155 MT grams. Our best estimate of 450 MT for the UK clearly falls within this range. Similarly, our best estimate of the
total UK expenditures (€1.5B) is very close to the value generated by Pudney et al. (€1.55B +/- 0.649).
Not surprisingly, our expenditure estimate for the United States (€14.2B) is about 50% larger than the estimate generated
by Abt (2001) for 2000 (€9.92B). We estimate that ~3,000 MT of cannabis were consumed in the U.S. compared to
their ~1,000 MT; however, our expenditure estimates are not three times as large since we apply a lower price per retail
gram. The discrepancy in total grams consumed makes sense since we 1) do not focus exclusively on past month users,
2) assume the average past month user paid for 96 grams a year instead of 88 grams, and 3) make adjustments for
underreporting. 15 The interagency Drug Availability Steering Committee16 (Drug Availability Steering Committee (DASC),
2002) expressed concern that the Abt figures were too low for cannabis, and referred readers to an unpublished estimate
by the DEA Statistical Services Section which suggested that 4,270 metric tons of cannabis were consumed in 2000. A
table published later in the DASC text (5-8) suggests that this 4,270 MT figure was based on this estimation formula:
“11,700,000 x 1 gram x 365”, where 11,700,000 is labelled as the “User value” (a number that is very close to the
10.7 million past month marijuana users reported in 2000 NHSDA) and the “1 gram x 365” presumably means these
users consume a gram a day on average. If interpreted correctly, this implies that the vast majority of past month users
consumed approximately two joints a day for an entire year. This seems unusually high and it is not clear whether DASC
strongly prefers this unpublished estimate. It is somewhat reassuring, however, that our best estimate (2,948 MT) falls
nicely in this range discussed by DASC.
It appears that our approach may overestimate the size of the retail market in France in 2005 (Legleye et al., 2008: €746-832
M; Estimate from Table 3.7: €2,232 M). There are a few possible explanations for this discrepancy. First, the French estimate
is based on past month users while ours includes anyone who consumed in the previous year. Second, the French estimate
assumes €4 per gram whereas we use €5.60 based on the EMCDDA data.17 Third, we adjust the final estimates to account
for underreporting.
There is also a difference between our expenditure estimate our methodology produces for New Zealand (€320.3) and
what was reported by Wilkins and colleagues for 2001 (€120). Besides adjusting for underreporting, another reason for
the discrepancy is that our figures are based on Slack et al.’s (2008) estimate for all users in the country aged 13-64 in
2005/2006 whereas the Wilkins et al. estimates are for those aged 13-45 covered by the household population survey in
2001.18 An additional reason for the discrepancy is the implied difference in the estimates for typical amount consumed for
a user. Whereas our best estimate assumes that the average amount consumed for anyone who used in the previous year
is approximately 96 grams, figures published in Wilkins et al. (2005) imply that this figure is lower for the population they
examine.19 As noted earlier, the Slack et al.’s (2008) estimate for New Zealand suggests an average annual consumption to
be 98 grams per user, much closer to our estimate.
At the beginning of this chapter we noted that the UNODC figures imply that retail cannabis expenditures in the U.S. are close
to €40B—more than three times the figure we generate as our best estimate. This is not entirely surprising since the UNODC
assumes that every past year user consumes on average 165 grams whereas we assume an average of 96 grams. Further, the
UNODC applies an average retail price that is more than twice as high as the figure we use (€4.8 and €12.5, respectively).
We prefer our price figure since it is based on self-reported information from cannabis buyers who consumed or gave their
cannabis away, and hence has been purged of individuals who might have also resold some of their cannabis. Further, our
estimate accounts for the quantity discounts that often occur at the retail level. In both the United States and New Zealand,
the typical amount purchased is greater than one gram (Wilkins et al., 2005; Caulkins & Pacula, 2006)
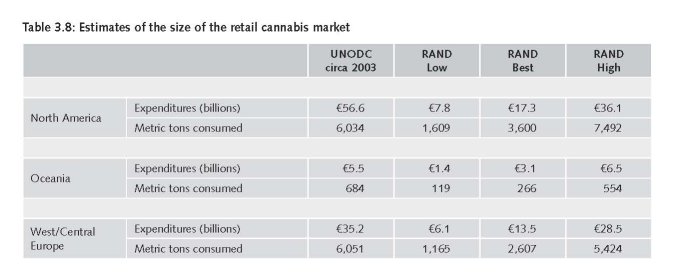
Summing the country estimates by region allows us to make crude comparisons with the macro estimates generated by the
UNODC. Table 3.8 displays the results by region as well as estimates published in the World Drug Report. While the UNODC
estimates are inflated from €2003 to €2005, they are not directly comparable to the RAND results since they cover different
years. Still, the differences in the estimates are striking. For expenditure and consumption in all three regions, the spreadsheet
model produces results that are dramatically smaller than what is reported in the World Drug Report (WDR). For example, the
UNODC estimates that over 6B grams of cannabis were consumed in North America and our best is substantially lower.
While Table 3.8 only includes countries from three of the 16 regions used in the UNODC macro estimates, the UNODC
estimates that these 33 countries account for 78% of the global cannabis retail market and hence represent the bulk of their
global estimate. Because adequate data are not available for the other 13 regions (22%), the work presented in this report
focuses on improving the estimates for the three regions and takes as correct those estimates constructed by the UNODC
for the other 13. Inflating the 2002/2003 estimates for these 13 regions to €2005 and aggregating them generates a base
estimate of the size of the retail cannabis market of €35B.20 Assuming that consumption patterns have remained relatively
stable in these 13 regions between 2002/2003 and 2005 (not an unreasonable assumption), adding this figure to the sum
of the best estimates for North America, Oceania, and Western and Central Europe generates a global estimate of the retail
market for cannabis of approximately €70B—about half of what the UNODC estimated for 2002/2003. A similar computation
employing the low and high estimates for the three main regions generates an approximate range for the global retail market
of €40B and €120B.21
4 Unless noted, all monetary values are in €2005.
5 Publicly available at: www.whitehousedrugpolicy.gov/publications/drugfact/drug_avail/
6 To account for the highly skewed nature of drug price data, we use the geometric mean instead of arithmetic mean when generating price
information.
7 To account for the highly skewed nature of drug price data, we use the geometric mean instead of arithmetic mean when generating price
information from ranges.
8 98 days = (365 days * 0.164) + (52 weeks * 3 days * 0.228) + (12 months * 1 day * 0.119) + (6 days * 0.178) + (1.5 days * 0.331).
9 Similar to the section on the previous number of use days, there is some evidence suggesting that U.S. purchase patterns may be similar to the
purchase patterns in other developed countries. Data from the 2001 HH survey in New Zealand suggests that 59% of past-year cannabis users
purchased at least some of their cannabis (Wilkins et al., 2005). Analyses of the 2001 HH survey also find that 59% (10,944,1610 / 18,650,770)
of past year users made a cannabis purchase in the previous year (Caulkins & Pacula, 2006; Table 3). In addition, there is evidence from an
international survey of young detainees and dropouts in four cities (Amsterdam, Montreal, Philadelphia, and Toronto) which suggest similarities
in how cannabis is obtained (Harrison et al., 2007b).
10 If the free cannabis was received from someone who never originally purchased it in the marketplace (e.g., they grew it themselves at home), it
is difficult to know the actual value of the cannabis consumed.
11 Since herbal cannabis dominates the markets in Oceania and North America, resin prices are ignored for these countries.
12 Limiting this to purchases by non sellers <= 1 ounce slightly increases the price to €5.12.
13 Interviews with three different groups of frequent drug users (methamphetamine, ecstasy, and IDU; Wilkins et al.,, 2006) in NZ in 2006 suggest
a mean and median price for 1.5 grams (a “tinny”) equal to NZ$20. For small purchases, “tinnies” are much more common than joints (Wilkins
et al., 2005b). While heavy drug users probably know the market better than the general public and might be expected to pay lower prices, the
fact that the median and mean equal $20 for each of the three groups suggests that this is probably close to the typical market price. Converting
this to Euros and dividing by 1.5 generates €7.6.
15 The Abt (2001) estimate is based on a projection for 2000. A correction using 2000 data by the Drug Availability Steering Committee (2002) put
the figure at 927 MT.
16 Members of the DASC included senior-level executives from the following organizations: Office of National Drug Control Policy, Department of
Justice, Department of Defense, Department of Treasury, Drug Enforcement Administration, Crime and Narcotics Center, the U.S. Interdiction
Coordinator’s office, U.S. Customs Service, and U.S. Coast Guard.
17 The geometric mean is based on €4.90/gram for resin and €6.40/gram for herbal.
18 The Slack et al. figure is based on a weighted average for occasional and frequent users from the household survey and the Illicit Drug Monitoring
System.
19 Wilkins et al. (2005) estimate the value of total purchases for their sample to be $NZ 576,253, with the average annual purchase amount to be
$1,313. This suggests that there were approximately 439 purchasers in their sample. With this population purchasing a total of 48,717 grams,
this suggests that the average purchaser purchased about 111 grams throughout the year. If we multiply this by the number of purchasers aged
13-45 believed to be in the household population (144,665), the total grams purchased by the household population would be 16,057,815. If
we divide this by the total number of past year users (not just purchasers) in full household population (362,140=0.19*1906000), we generate
an average of 44 grams per user. Note that this figure is low since it does not consider all of the homegrown cannabis that is consumed by
growers and shared with those in the houseful population. Further, Wilkins et al. (2005) suggest the NZ household survey underestimates heavy
cannabis users. This accounts for a large share of the discrepancy.
20 €28B * 1/(1-0.2) = €35B.
21 €28B * 1/(1-0.391) + €36.1B + €6.5B + €28.5B = €117B.
| < Prev | Next > |
|---|


