Report 2 Heroin
| Reports - A Report on Global Illicit Drugs Markets 1998-2007 |
Drug Abuse
Report 2 Heroin
This section presents country-specific consumption and retail expenditure estimates for heroin circa 2005. Unlike our
quantity consumed estimates for other drugs which are based on average number of use days and average amount
consumed per use day for different types of users, this section relies upon new consumption estimates based upon a recent
international literature review (Paoli, Greenfield, & Reuter, 2009). Since these new estimates are presented in terms of
pure grams consumed for a user over the course of a year but prices are not available on a purity adjusted basis, the final
expenditure estimates are presented for different potential values of retail purity.
The following subsections discuss the data sources and assumptions made to generate our expenditure and consumption
figures. We highlight the major sources of uncertainty and note peculiarities in the available data. The final section will
compare our results with the small number of studies that have attempted to calculate the size of the retail market for
particular countries. Since these results are calculated differently than our estimates for the cannabis and cocaine markets,
readers should exercise caution when making comparisons or attempting to sum the figures to generate one figure for the
size of the global market for the major illicit drugs.
4.1 Prevalence data
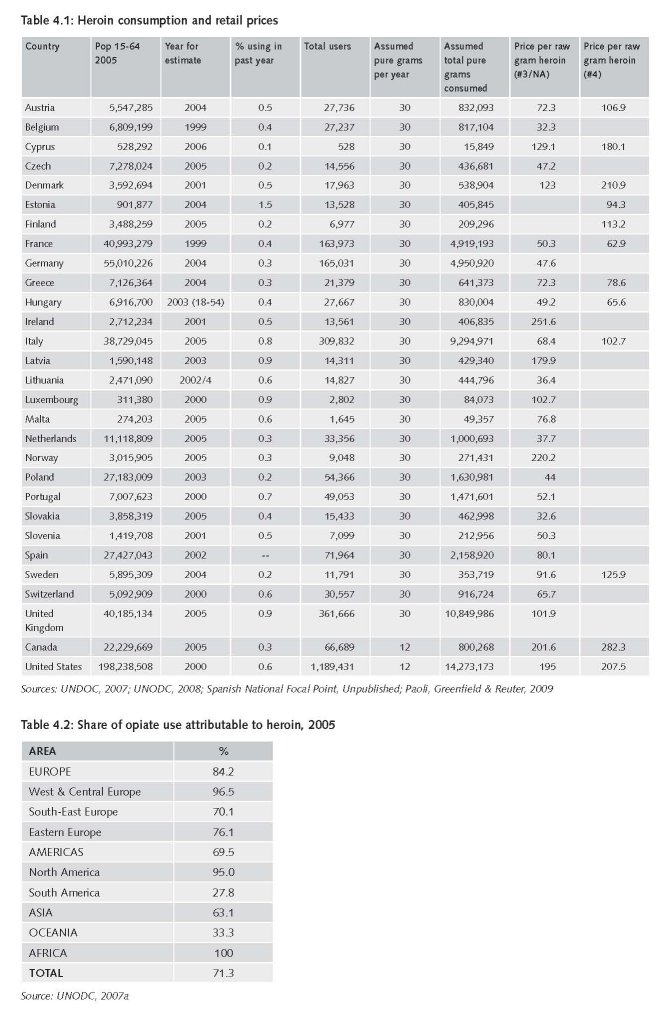
For the majority of countries with sizable retail opiate markets (in terms of users and/or expenditures), we rely on prevalence
data collected by the UNODC which come from a variety of sources and often do not cover the same time periods (Table 4.1).
For example, the most recent estimate for France is from 1999, for Spain it is 2002, and for the United States it is 2000 (based
on the aforementioned Abt study). This makes it virtually impossible to assess country-specific trends in opiate consumption in
most places (especially for the 1998-2007 period). These opiate estimates from the UN include opium, heroin, and synthetic
opioids but the UNODC estimates that almost all of the consumption (at least 95%) in Western and Central Europe, Canada,
and the United States is for heroin (Table 4.2). Thus, for the calculations we will assume that all opiate purchases are for
heroin. Since heroin accounts for a smaller share of opiate consumption in other regions and the price data for opium and
synthetics are sparse, we do not present estimates for these regions. Consumption information on the major markets excluded
from this section is available in Annex 3.
The EMCDDA has encouraged and collected estimates of problematic drug use from member countries, but these data are also
not available for all countries for the same year. While some of these estimates only report the number of IDUs (which could
include amphetamine and cocaine), some countries do report problematic opiate use separately. While detailed comparisons
of the methodologies employed to create the EMCDDA and UN estimates are beyond the scope of this report, there is one
important discrepancy worth noting. The UN data for Spain in 2002 suggest that the number of opiate users was less than
55,000 (WDR, Table 1), but the 2002 range for problematic users of opiates reported to the EMCDDA ranges from 71,964 to
102,822; a difference of 30% to almost 100% (Spanish National Focal Point, unpublished). For now, we will use the lower bound
of this range for the Spanish calculations and recognize that future work must delve deeper into these inconsistencies.

4.1.1 Quantity consumed
As with cannabis, we know relatively little about the typical quantities consumed, especially with respect to pure grams of
heroin. For quantity consumed, we rely on the consumption estimates generated from Abt (2001) and Paoli et al.’s (2009)
recent international literature review, which focused heavily on Europe. Based on Abt’s (2001) calculations for 2000, we
assume that the average heroin user consumes about 12 grams of pure heroin a year22. This also has face validity since we
would expect the figures for the U.S. to be much lower than Europe because of the relatively high price in the former.
Based on a sophisticated analysis of heroin consumption among arrestees in the UK by Singleton et al. (2006), Paoli et al.
(2009) calculated that users, on average, consume approximately 29 pure grams per year. Paoli et al. (2009) also discussed
Bramley-Harker’s (2001) estimate for the UK which is closer to 40g per year, and note that this figure is likely to be high since
it assumed that none of the heroin users spent any time in the previous year in prison or jail. Based on these findings and
their review, Paoli and colleagues conclude: “We believe that an estimate of 100 pure milligrams per user per day—consistent
with an annual estimate of about 30 pure grams—for countries with opiate prices that are, relative to average earnings, much
lower than the United States, is reasonable and not inconsistent with judgments of experts.”
The assumption of 30 grams for users in Europe is much smaller than the figure offered by UNODC (58 grams). As Paoli et
al. (2009) note, there are several reasons to believe that this figure of 58 grams is too high:
“UNODC (2005d) reports a global average of 28 grams per annum and a European average of 58 grams. For validation
of the higher figure, UNODC cites the results of a U.K study on people entering treatment in 1997, which it states implies
68 grams (Gossop et al., 1997). However, treatment research (e.g., Anglin & Hser, 1990) has consistently found that users
enter treatment at times of peak use; thus, reports of use in the period immediately before treatment entry will overstate
average use rates. Moreover, treatment entry is itself not randomly distributed across dependent users; those with more
severe problems have a higher probability of being referred to treatment as a consequence of arrest. Thus we believe that
the figure is too high.”
4.1.2 Price
The price data for raw grams of heroin are pulled from the World Drug Report and in most cases they cover 2005. As reported
in Table 3.1, most countries report only one price for heroin and it can be presented as unspecified (NA), Number 3 (brown
heroin - less refined); or Number 4 (white heroin—more refined). Some countries do report prices for more than one type
of heroin. Our estimates assume that all of the heroin consumed are purchased at the retail price published by UNODC and
that there is no gifting. While sharing does occur, it is less likely for expensive drugs where heavy users often have to worry
about having their drugs stolen from them (Simon & Burns, 1997). The risk of theft also creates a disincentive for making
large bulk purchases at the retail level.
4.1.3 Purity
Purity-adjusted price series are not readily available outside of the U.S. and Australia and this is one of the most significant
limitations to estimating the size of the market and understanding how it works. The UN does provide some purity data at
the retail level, but this is available for less than 25 countries (in the 2007 WDR) and many of the ranges are too wide to be
useful (e.g., Canada: 1-100%; UK: 1-87%; U.S.: 12-95%). There are also examples of ranges that are so small that they do
not seem credible (e.g., France: 2-10%). When ranges are provided, point estimates are not. Despite the lack of systematic
data, we do know that there is large amount of variation across and within countries. Further, there is also a lot of variation
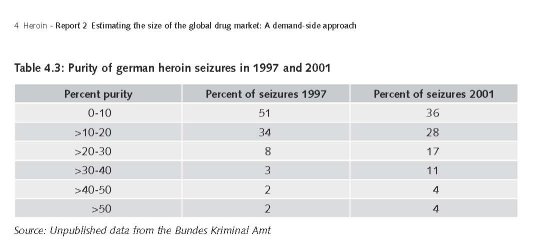
within countries over time. For example, in Germany the variation in recorded purity is large within any one year and rapidly
changing, as indicated in Table 4.3.

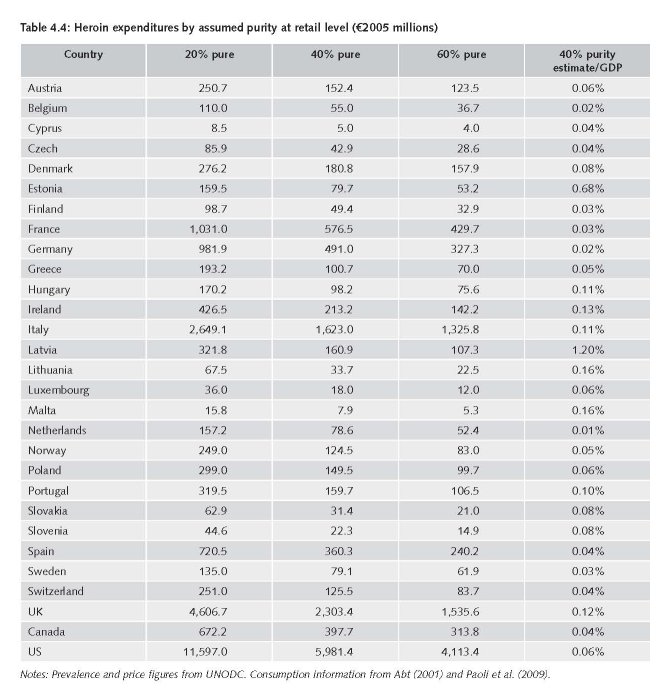
Since our quantity consumed measure is based on pure grams and prices are not available purity adjusted, we present
country-specific expenditure estimates for three different levels of purity at the retail level: 20%, 40%, and 60%. This is not
intended to suggest that retail purchases are never below 20% or above 60%;23 rather, we present these scenarios to display
how sensitive results can be to assumptions about purity. To calculate the prices for the 20% level, we use the lowest price
reported for heroin; for 40% we use the geometric mean when more than one price is reported; and for 60% we use the
highest price reported. For Asia, we use a weighted average based on the share of opiate consumption attributable to opium
and heroin.
4.2 Results and discussion
Table 4.4 presents retail expenditures for the countries believed to account for the vast majority of the market.
There are some important similarities between these figures and others in the literature. First, the 40% estimate for the UK
(€2.3 B in 2005) is reasonably close to the point estimate generated by Pudney et al. for heroin in 2003/4 (€1.8 B +/- .342).
Second, the 40% estimate for the US (€7.2B in 2005) is reasonably close to the point estimate generated by Abt for heroin
in 2000 (€9.45B). Part of this discrepancy can be attributed to the 13% decrease in the price for a pure gram of heroin in the
United States from 2000 to 2005 (Arkes, personal communication). Third, the sum of the figures for US and Canada at 40%
(€7.6 B) is very close to what the UNODC found for North America in 2002/2003 (€7.9 B). Finally, our estimate of the total
pure grams consumed in the U.S. (14.3 MT; Table 3.2) is consistent with the DASC’s (2002) estimate that there is between
13 and 18 MT of pure heroin available of in America. Of course, the amount consumed will be less than the DASC estimates
since some of this heroin is confiscated, but it is encouraging to know that our crude calculations are reasonably close.
But the glaring discrepancy between these figures and the UNODC estimates is with Western and Central Europe. Our
calculations for this region for 60% and 20% purity are roughly €5 B and €14 B, respectively, while the UNODC puts estimates
expenditure to exceed €22 B. This is largely attributable to the aforementioned fact that UNODC estimates suggest the
average user uses 58 pure grams a year, whereas we assume a value of 30 grams.
22 13.3 pure metric tons / 1.1 million heroin users.
23 For example, the EMCDDA suggests that brown heroin purchases range from 15-25% purity and white heroin ranges between 45-70% in most
Member States.
| < Prev | Next > |
|---|


