Report 2 Cocaine
| Reports - A Report on Global Illicit Drugs Markets 1998-2007 |
Drug Abuse
5 Cocaine
This section focuses on expenditure and consumption estimates for the nine countries believed to account for most of the
world’s retail cocaine market (seven in Europe, two in North America). While the data used to estimate the size of the global
retail market for cannabis are limited, they are much richer than what is available for cocaine. This is especially true for Europe
where some countries appear to be in the early stages of a cocaine epidemic (The U.S. was at its peak nearly 25 years ago).24
The lack of data requires us to make strong assumptions about large markets and we are not comfortable making assumptions
for the smaller markets for which there is even less information. Still, we hope that generating ranges for these nine major
countries will improve understanding of the size of the retail market. Furthermore, this exercise will highlight the data gaps
that need to be filled to calculate more precise estimates.
5.1 Europe
The subsection focuses on the seven European countries that account for roughly 90% of current past-month cocaine users
in Europe: France, Germany, Italy, Netherlands, Poland, Spain, and the United Kingdom (EMCDDA, 2007b). Similar to the
cannabis section, we attempt to generate country-specific ranges using readily available country-specific prevalence and price
data as well as region-specific assumptions about quantity consumed. Pudney et al. (2006) provide a rigorous estimate of
the size of the powder and crack cocaine markets in the UK in 2003/4; one reasonable approach for the UK would be to
update this to reflect 2005. But since we are tasked with generating estimates for multiple countries, we will use a different
methodology that can be applied to all European countries and then use Pudney et al. (2006) to assess the face validity of
our estimates.
While crack cocaine is available throughout Europe, powder cocaine dominates the market in all countries except the UK
(EMCDDA, 2007b). The EMCDDA special report on cocaine notes, “In Europe, crack cocaine use seems to be stable at a
low level and concentrated among certain marginalized subpopulations in some cities” (2007b, 9). Pudney et al. (2006)
estimate that crack accounts for the majority of cocaine expenditures and pure grams consumed in the UK, and more than
half of cocaine treatment admissions in the UK are for crack (EMCDDA 2007a, TDI 115). Indeed, the UK appears to account
for over 80% of all primary crack episodes in Europe. Thus, this European section will only incorporate information about
crack for the UK; in other countries all cocaine users will be treated as powder cocaine users. This turns out to be a fairly
non-consequential assumption.
As with cannabis, we use Equations 1 and 2 to estimate total consumption and retail expenditures for European countries.
However, for cocaine we assume that all end users purchased their product. This is a strong simplifying assumption and we
have no reason to believe that it is correct. More research needs to be conducted on the level of gifting among light and
heavy users, especially in European settings. But as mentioned in the previous section, gifting is likely to be less common for
the more expensive drugs.
5.1.1 Number of users
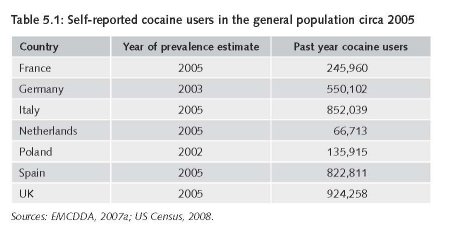
The estimate of users is based on the number of past-year cocaine users in the general population as reported in the
EMCDDA’s Statistical Bulletin 2007 (Table 5.1). Since these figures generally exclude those not covered by the household
surveys, they should be viewed as conservative. But considering that many European countries are in the early stages of an
epidemic, we would expect estimates from the household surveys to be relatively more accurate than if the countries were
at the end of the epidemic (as is the case in the United States).
5.1.2 Underreporting
For prevalence-based cocaine estimates, a large hurdle is estimating the amount of underreporting that occurs given the
stigma associated with powder and crack cocaine. As cocaine is an expensive drug, this underreporting has significant
implications for calculating the size of the global drug market. Some of the available European evidence on this comes from
arrestee populations in the UK, and the results are inconsistent. Pudney et al. (2006) report that according to the 2003/2004
Arrestee Survey (England), 40% of those testing positive for cocaine did not self-report using crack or powder cocaine within
48 hours of arrest. They also report information from a different arrestee survey conducted in England and Wales from
1999-2002 (NEW ADAM: New England and Wales Arrestee Drug Abuse Monitoring) suggesting that the rate of cocaine
underreporting is 15.3%.25 Both of these figures are higher than an earlier NEW ADAM analysis suggesting that only 3.9%
of the arrestees tested positive but did not report using cocaine (Taylor & Bennett, 1999). The corresponding figures for
arrestees in the United States range from 17% to more than 50%, with most of the figures near the top of the range (Hser
et al., 1999; Taylor & Bennett, 1999; Liu et al., 2001; Authors’ analyses of 2003 ADAM data).
While it is not surprising that there is underreporting among arrestees who may be suspicious of research inquiries about
illicit drug use, evidence from the United States suggests that cocaine underreporting may be even higher in the household
population. As noted in Table 2.1, Harrison et al., (2007a) found that only 21% of respondents aged 12-25 who tested positive
for cocaine self-reported using powder or crack cocaine in the previous thirty days (Harrison et al., 2007a, Table 6.5). Whether
or not it extends to those older than 25 is an empirical question; however, this high denial rate consistent with another largescale
study considering three populations in the Los Angeles area (Hser et al., 1999): 1) sexually transmitted disease patients
(N=1,419), emergency room patients (N=1,115), and arrestees (N=1,982). Of those testing positive for cocaine in these three
groups, the share self-reporting no use within the previous three days was 69%, 59%, and 37%, respectively; this suggests that
the denial rate for those in the criminal justice system may not always be smaller than it is for other populations.
While it is beyond the scope of this project to precisely estimate the denial rate for each country (and impossible to do with
existing data), we would be remiss if we did not attempt to incorporate this into our estimates given these extremely large
discrepancies. Thus, for our low estimate we will assume that there is no underreporting and for our best estimate we will
assume that survey information only captures 66% of total cocaine consumption within a country (i.e., we will multiply the
total grams consumed in our high estimates by 1.5). We use this highly speculative figure for a few reasons: 1) Data from
Abt (2001) suggests that “about 65 percent of cocaine users were deemed truthful” (p. 39), and 2) while the intra-country
ranges presented above are wide, assuming that two-thirds of the respondents were honest is consistent with some of the
studies in the UK and US. For our high estimate we will assume that only 50% of those respondents honestly report their
powder or crack cocaine use. We fully acknowledge that applying this figure to the high estimate dramatically increases our
range and makes it difficult to be confident about the true value.
5.1.3 Heavy versus light users
We follow the useful modelling convention developed by Everingham & Rydell (1994) and used by others (e.g., Caulkins et
al., 2004) of classifying past-year users as either heavy or light users. Those who use cocaine less than three times a month
are defined as light users and everyone else is considered a heavy user.
While it is easy to obtain information about the share of past-year users who used in the past month, obtaining more detailed
information regarding the frequency of drug use in the past year or month from the household surveys in Europe is difficult.
Indeed, the EMCDDA asked member states to include a special section about cocaine use for their 2006 national report and
the UK (which has a relatively large cocaine-using population and strong data infrastructure) report noted:
Even with the large numbers surveyed by the BCS [British Crime Survey], numbers using recently [past 30 days] are too small
to provide reliable evidence of frequency of use and therefore are not considered in this report” (171).26
Frequency data based on the 2003 Household Survey in Italy suggest that among past-year users, 78% used once or less
in a month, 13% used 2-4 times in a month, 6% used 2-3 times in a week, and 4% used 4 times in a week. Unfortunately,
these data do not fall nicely into the same categories used in the Everingham & Rydell modelling convention. If we first
assume that the distribution of users within the 2-4 times a month category is uniform, then we can calculate that 82.3% of
past year users (= 78% + 1/3 *13%) and 17.7% of past year users are heavy users. If instead we assume that most of the
people reporting in the 2-4 times category use at the lower end, say 50%, then we can get a lower estimate of heavy users
given by 16.5% (= 6% + 4% + ½ * 13%). Given the similarities, we will multiply the number of past year users by 17% to
generate the number of heavy users.
If one is willing to assume that the distribution of light to heavy users for other European countries can be approximated by
the shares for Italy, then we can use these fraction of past year users as parameters to determine the number of light and
heavy users in each country using the country-specific annual prevalence rate for cocaine. Of course, there is good reason to
doubt the validity of this assumption, but without country-specific data on frequency of cocaine use in the past month in the
HH population, there is no better information available on which to build an alternative assumption.
5.1.4 Consumption days for heavy and light users
Prinzleve et al.’s (2004) multi-city study of cocaine use in Europe inquired about consumption days in the past 30 days for
three different groups of users: Those in treatment (mainly opioid substitution maintenance), socially marginalized users not in
treatment, and socially integrated users not in treatment. The sample for the nine cities is relatively large (1855 users, roughly
600 in each group), but the estimates are neither representative nor precise. The mean number of use days in the previous
month (standard deviation in parentheses) was 11.2 (11.1) for the treatment group, 13.9 (12.6) for the marginalized group,
and 7 (6.7) for the integrated group. If we assume the same level of consumption for the entire year (by multiplying each
figure by 365/30), we get annual use-day estimates of 136, 169, and 85 days, respectively. For the lack of better information
about use in Europe, we assume that the average number of use-days for a heavy user is uniformly distributed between 85
and 169 days.
We are currently unaware of data sources that provide the annual number of use days for either past month users or light
users in Europe. This is troubling since these lighter users tend to account for most cocaine consumption early in an epidemic.
For the lack of better estimates, we focus on the extreme values for the low and high values. For the low value, we assume
that the user only used once in the previous year. For the high value, we assume they used twice a month (still technically a
light user) for the previous year. Assuming a uniform distribution, the average light user will use approximately once a month
[12.5 days = (1 day+24 days)/2].
5.1.5 Consumption per use day
The EMCDDA’s (2007b) special report on cocaine and crack use noted that data about quantities of cocaine “are limited and vary
between studies (15).” Indeed, the lack of data is evidenced by the fact that the EMCDDA’s report references only one study
about quantity consumed, and this was based on a magazine survey of UK clubbers that was sourced as personal communication.
For powder cocaine, Pudney et al. (2006) assumes that intensive users use 0.8 raw grams per use day (+/- 0.2 grams) and
non-intensive users consume 0.55 raw grams per use day (+/- 0.2 grams).27 The authors generate these figures based on
information from Australian household data, personal communication with the NCIS, and the Drugscope website. For this
estimate, an intensive user is defined as someone who used in the previous week, which roughly corresponds to our definition
of heavy user (used more than 2 times in the previous month).
Gossop et al. (2006) interviewed past-month cocaine users in clinical and non-clinical settings outside of London to learn more
about how cocaine consumption during an episode changed when alcohol was also consumed. Typical amounts of powder
cocaine consumed ranged from 0.2 grams when alcohol was not consumed to 0.9 grams when alcohol was also consumed.
While the paper does not explicitly report the share of cocaine episodes involving alcohol, other passages in the text imply this
is over 90%; suggesting that the 0.9 gram figure is more likely to be representative of a typical amount consumed. Since this
sample included those in clinical settings as well as those not in treatment, one could argue that it is probably a reasonable
estimate of the amount consumed for an intensive user.
As for crack cocaine, Pudney et al. argue that there is little systemic evidence about quantity consumed and that unreliable28
arrestee evidence “suggests a level only slightly lower than that for powder cocaine” (66). They suggest that this difference
may attributable to the fact that crack has a higher level of purity than powder cocaine. Gossop et al. (2006) find that typical
amounts of crack consumed do not dramatically differ when alcohol is consumed (1.1 grams) or not (0.9 grams). Since they
find that concurrent crack and alcohol use was far from the norm in their snowball sample, we should give more weight to
the lower bound estimate (0.9 grams). Since this is well within the range we are using for powder cocaine, we do not include
separate quantity consumed estimates for crack and powder cocaine. Thus, for the upper bound estimate we assume 1 raw
gram per use day.29
5.1.6 Price
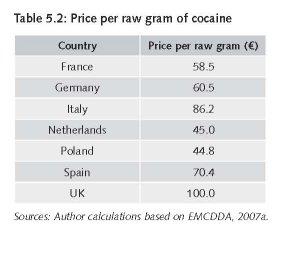
Purity-adjusted prices are not available for Europe, so our results are based on average price per raw gram as reported by
the EMCDDA. When only a high and low estimate is presented, or the mean is simply the midpoint of the high and low
estimate, we use the geometric mean of these values for the price. Otherwise, we simply use the reported mean. All prices
are for powder cocaine except for the UK which is the geometric mean of powder and crack cocaine.
5.2 Cocaine consumption and expenditure in North America
Whereas we believe that those covered by the household surveys currently account for the vast majority of cocaine consumption
in Europe, this is definitely not the case in the United States (Abt, 2001; Caulkins et al., 2004). Accordingly, this requires
using a different methodology for constructing price information in North American than what is used for Europe.
5.2.1 United States
There have been two major attempts to generate cocaine consumption estimates for the United States (Everingham & Rydell,
1994; Abt, 2001). Each used a different strategy to 1) account for cocaine users not covered by the household population and
2) estimate the share of “heavy” or “chronic” users. Everingham and Rydell’s (1994) model of cocaine initiation and demand
is based on the household survey and they attempted capture “missing” heavy users by incorporating prevalence information
for homeless and incarcerated populations. Abt’s (2001) model also used survey data from the household population, but it
is primarily based on arrestee surveys. Since arrestee surveys were only conducted in select jurisdictions (as part of the DUF/
ADAM program), advanced statistical techniques were used to extrapolate these results and generate national estimates.30
Despite these different methodologies, recent work by Caulkins et al. (2004) highlights that there are considerable similarities
in the total number of users for the overlap years (1988-1993).31 For example, in 1993 Everingham & Rydell calculated there
were 6.29 million past year users (Light = 4.05, Heavy = 2.24) whereas Abt calculated 6.41 million (Occasional = 3.33,
Chronic=3.08). However, there is a difference for the share of frequent users. Recall that Everingham and Rydell define
“heavy” as anyone using more than two days in the past month; for Abt, a user is considered “chronic’ is they used more
than nine days in the previous month. Thus, the fact that the Abt estimate for chronic users exceeds the E&R estimate for
heavy users suggests that the Abt approach would likely lead to a larger estimate of total grams consumed. However, this is
not the case. Despite using different methodologies with different limitations, the Abt estimate for 1993 was 331 pure MT32
which is almost identical the 332 pure MT we derive from E&R for 1993 (4050000 users*16.42g + 2240000*118.9g).33
The work by Caulkins et al. (2004) is also important because they update some of the parameters used in Everingham &
Rydell’s model of cocaine initiation and demand as well as make consumption projections through 2012 (thus covering
2005, our year of interest). Assuming a constant rate of cocaine initiation between 2000 and 2005 (based on the average
of 850,000 new initiates each year), Caulkins et al. (2004) projected 3.84 million light users and 1.6 million heavy users in
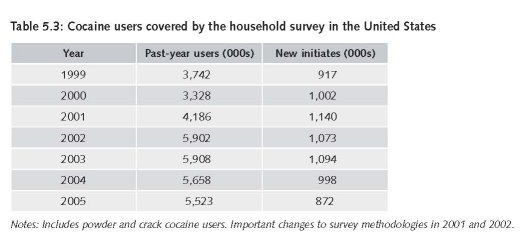
2005. Changes in the sampling methodology used by SAMHSA to generate the household survey between 2000 and 2002
make it difficult to compare initiation rates (or any other measure) over this period,34 but if the post-2000 rates of cocaine use
(converted to population numbers in Table 5.3) are not substantially influenced by changes in the design and implementation
of the household survey, then figures based on 850,000 initiates a year would likely underestimate the total number of users.
Interestingly, Caulkins et al.’s past-year prevalence projection for 2005 (5.44 million users = 3.84 million light users + 1.6
million heavy users) is remarkably close to the figure reported in the 2005 NSDUH (5.5 million).
Future work should incorporate these newer prevalence and initiation estimates into these Markov models, especially since
they seem to be much higher than what was estimated in the past. NSDUH 2002 notes:
“Several improvements to the survey were implemented in 2002. In addition to the name change, respondents were offered a
$30 incentive payment for participation in the survey starting in 2002, and quality control procedures for data collection were
enhanced in 2001 and 2002. Because of these improvements and modifications, estimates from the 2002 NSDUH should not
be compared with estimates from the 2001 or earlier versions of the survey to examine changes over time. The data collected
in 2002 represent a new baseline for tracking trends in substance use and other measures.”
Additionally, the fact that NSDUH generates accurate numbers of those on probation and parole suggest that the new
methods may increase the share of “marginalized” populations that account for a large share of drug use.
The other important issue at hand is how to account for the vast majority of cocaine users near the age of initiation who lied
about their cocaine use. The average age for initiation is about 20 years (NSDUH 2004) and recall that Harrison et al. (2007a)
compared self-report and drug tests results for nearly 4,000 respondents aged 12-25 in the household survey. Harrison et al.
did not report the validity results by initiation status and there are initiates older than 25, so the results may not be directly
comparable. As noted earlier in the report, our approach to address this underreporting is to assume that it is zero for the low
estimates and multiply the high estimate by 2.
The estimate for the retail price of a pure gram of cocaine in 2005 was generated using micro data from the DEA’s STRIDE
database (€86.67).
5.2.2 Canada
The most recent household survey in Canada was for 2004 and it was estimated that 1.9% of the household population used
cocaine or crack in the previous year (CCSA 2005). Multiplying this by the population aged 15-64 in 2005 generates 422,000
past year users. Given its proximity to the world’s largest cocaine market and its similar per capita income, we assume a similar
ratio of heavy to light users and employ the same assumptions and ranges as used for the United States (including price).
5.3 Results and discussion
Table 5.4 demonstrates how we generate our consumption and retail figures for European countries, using Spain as the
example. After separating the past year users in the household into light and heavy users, we multiply these figures by
the annual grams consumed (use days*average grams used per use day), which is different for the low, best, and high
estimates. We then make an adjustment for underreporting and multiply this figure by the retail price per gram. Recall that
the calculations are slightly different for the United States and Canada since annual grams consumed is not based on use
days multiplied by average grams used per use day. Further, we only calculate a range for the United States and Canada.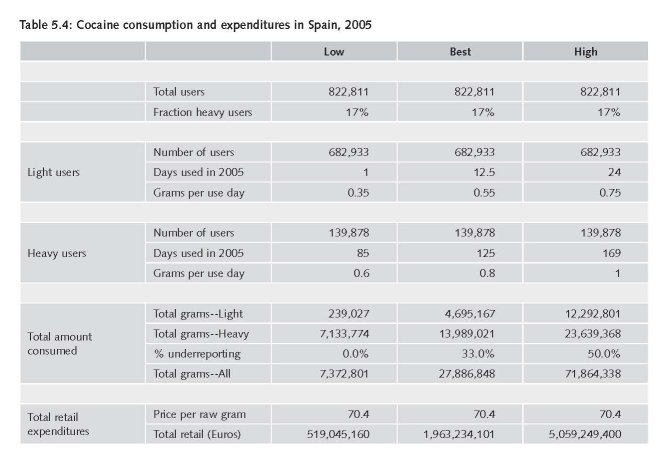
Table 5.5 presents the estimates of the size of the retail cocaine market circa 2005. Our results suggest that the UK has the
largest cocaine market in Europe, with retail expenditures on powder and crack cocaine ranging from €.8-€8.1 Billion. This
includes Pudney et al.’s UK range of €2.7-€4.7 Billion. Despite using different methodologies (e.g., we incorporate underreporting,
they include information from arrestee surveys), our ranges for total consumption (raw) are fairly similar (Pudney et
al: 6M to 60M; 35 RAND: 8M to 81M). What is most notable, however, is the size of the range for both studies. This highlights
how little we actually know about cocaine markets in Europe.
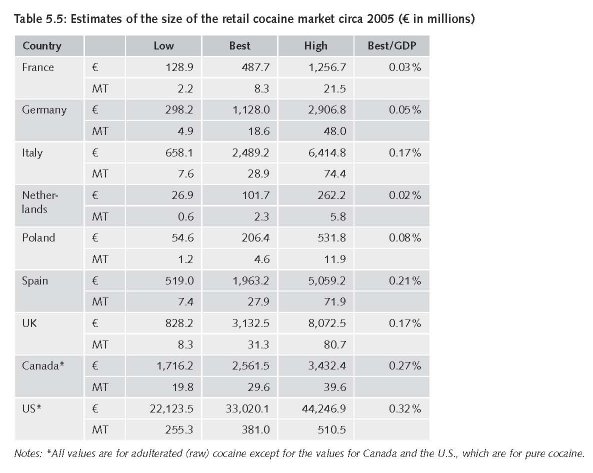
As expected, the U.S. accounts for the vast majority of global expenditures and grams consumed. While our low estimate
for consumption in the United States (255 MT) is similar to what Abt (2001) calculated for 2000 (250 MT), our expenditure
estimates are notably lower (€22B and €33B, respectively). This is not surprising since the price per pure gram of cocaine at
the retail level dropped about 30% from 2000 to 2005 (RAND analyses of STRIDE). Our best estimate of 381 MT is generated
by multiplying this low figure by 1.5 to account for 33% underreporting. Whether or not this is the most appropriate inflation
factor is clearly an empirical question deserving of additional research.
The uncertainty associated with cocaine markets is not limited to demand-side estimates.
There is also considerable debate about the amount of the land used to grow coca in Colombia in 2005 (by far the world’s
largest producer). While the UNODC estimates that 99,000 hectares were dedicated for coca cultivation in 2007, the U.S.
State Department estimates this figure to be over 157,000 hectares. We address this in more detail in Annex 1.
24 A useful description of how to think about drug epidemics is presented by Paoli et al. (2009): “In contemporary discourse, the concept of
“epidemic” is often used to describe the initial and usually precipitous but limited, phase of illicit drug demand creation and particularly the
sudden expansion of heroin demand in a variety of contexts from the 1960s onwards. The notion of a drug use epidemic captures the fact that
drug use is a learned behavior, transmitted from one person to another. Contrary to the popular image of the entrepreneurial “drug pusher”
who hooks new addicts through aggressive salesmanship, it is now clear that almost all first experiences are the result of being offered the drug
by a friend. Drug use thus spreads much like a communicable disease; users are “contagious,” and some of those with whom they come into
contact become “infected.”
25 Ultimately, Pudney et al. (2006) did not make adjustments for underreporting in their final estimates of the UK retail market. They note: “No
adjustment has been made for under-reporting by survey respondents. If made, such an adjustment would increase the estimates, with a larger
impact on “hard” than “soft” drugs” (75).
26 The report does include information about the share of past-month users aged 16-24 years who used cocaine more than once.
27 Consumption is based on raw grams, as that is all that people are able to report. Although the raw amounts appear close, the average purity of
cocaine consumed may differ between light and heavy users if heavy/regular users are better at evaluating the probable purity of the drug upon
physical inspection or have regular sellers from which they know they can get a purer product.
28 Their term, not ours.
29 For a U.S. treatment sample who used cocaine 20 or more days out of the last 30 and who used at least 4 days out of each week, Simon et al.
(2001) found that the typical consumption during a use day was 1.09 grams.
30 Related work was conducted by Brecht et al. (2003).
31 Caulkins et al. (2004) note “on average E&R reported 0.985 times as many total users as did Abt/ONDCP” (p. 320).
32 Abt (2001) bases this total consumption figure on total expenditure estimates from arrestees (adjusted for in-kind payments) and price per pure
gram of cocaine from the DEA’s STRIDE database.
33 As for grams consumed by type of user, Everingham and Rydell assumed that heavy and light users consumed 118.93 and 16.42 pure grams of
cocaine per year, respectively. This led to the widely-cited statistic that heavy users consumed 7.25 more per capita than light users (Caulkins et
al., 2004).
34 From the 2002 NSDUH: “Several improvements to the survey were implemented in 2002. In addition to the name change, respondents
were offered a $30 incentive payment for participation in the survey starting in 2002, and quality control procedures for data collection were
enhanced in 2001 and 2002. Because of these improvements and modifications, estimates from the 2002 NSDUH should not be compared with
estimates from the 2001 or earlier versions of the survey to examine changes over time. The data collected in 2002 represent a new baseline for
tracking trends in substance use and other measures.”
35 Calculated by summing the point estimates and uncertainty bounds for powder and crack cocaine. For powder they report 17.7 +/- 13.72 and
for crack they report 15.58 +/- 13.29.
| < Prev | Next > |
|---|


