Report 2 Amphetamine-type substances
| Reports - A Report on Global Illicit Drugs Markets 1998-2007 |
Drug Abuse
6 Amphetamine-type substances
Our final section focuses on amphetamine-type substances (ATS), namely amphetamines, methamphetamines, and ecstasy.
Despite the popularity of these substances (especially in Europe), we know very little about typical quantities consumed, which
makes generating demand-side estimates very difficult. These substances take many forms (especially across countries), come
from a variety of sources, and unless the drug is diverted from a legal source or tested by the user (e.g., at a rave), most users
only have a vague idea about what they are actually consuming. Further complicating our understanding is that many authors
do not explicitly state whether they are discussing the consumption of pure or raw milligrams of methamphetamine.
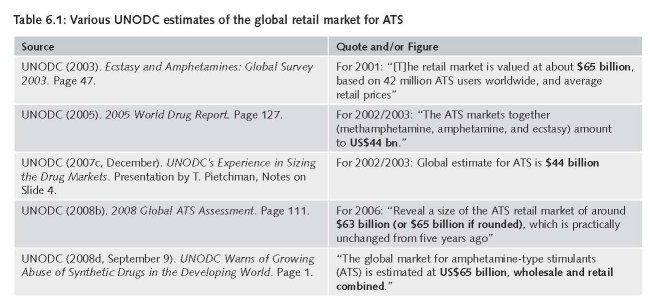
The uncertainty about ATS consumption and the size of the retail market is evident in the various estimates generated by
the UNODC over the past five years (Table 6.1). In the 2008 Global ATS Assessment, the UNODC calculates the global ATS
retail market in 2006 to be $63.4 billion, virtually identical to their $63.7 billion estimate for 2001.36 Both of these estimates
are different from UNODC’s previous ATS market estimate for 2002/2003 which is considerably lower ($44bn) and based
on a different methodology.37

This section briefly reviews the small literature on ATS consumption for each substance. Given the large uncertainty about
the consumption of ATS (namely consumption days and average amounts consumed on a use day), we are reluctant to
generate a “best” estimate for ecstasy and amphetamines. Instead, we only offer low and high estimates based on the very
thin literature. In the final subsection we include low, best, and high estimates of the methamphetamine market in the United
States for the household population.38
6.1 Quantity consumed
There is a lot of variation in the estimates of the quantity of ecstasy consumed. The UNODC input/output model suggests
that past year users used, on average, 10 pure grams of Ecstasy in Western and Central Europe, and 9 pure grams in North
America. The 2008 Global ATS Assessment assumed a global average of 100mg of Ecstasy per tablet, with a lower bound
of 60-70mg. This would suggest a range of 100 tabs (10g/100mg) to 154 tabs (10g/.65g) for Western and Central Europe
and 90 to 139 tabs for North America.
The UNODC estimates are larger than those generated elsewhere. Pudney et al. (2006) calculate that in 2004 between 32.6
M and 86.4 M tabs of ecstasy were consumed. With roughly 700,000 ecstasy users in the household population (EMCDDA,
2007a), this suggests a range of 47 tabs (32,600,000/700,000) to 123 tabs (86,400,000/700,000) per past year user.39
Additionally, in an assessment of the global ecstasy market, Blickman (2004) refer to a study by the Dutch National Criminal
Investigation Services40 which suggests “that the consumption per user is more likely in the range of 20-40 pills per year,
based on studies in Canada, the UK, Germany and The Netherlands” (8). To generate the largest, but still defensible range,
we use the 154 as the high estimate and the 30 from the Dutch National Criminal Investigation Services as the low estimate
for Western and Central Europe. For the U.S. and Canada we use a high estimate of 139 tabs.
There is even less information available for amphetamines. The UNODC input/output model for West and Central Europe
(2005) suggests that past year amphetamine users average 12 pure grams per year. Based on data from 2006, the UNODC
assumed that they purity of a retail gram of amphetamine in Western and Central Europe was 38% (UNODC 2008). If we
divide the 12 pure grams by the 38% purity rate, we get a consumption figure of 31.6 raw grams annually.
We are only aware of one estimate of the retail amphetamine market for a European country (Pudney et al.’s UK), and it relies
on consumption information from the Australian 2001 household survey. This is problematic since most of the amphetamines
used in Australia in 2001 were methamphetamines, which is a different substance.41 The figure is also troubling since no
distinction was made for intensive and non-intensive users (1 raw gram +/- 0.2 is used for both). Alas, this is the only figure
we could find in the published literature for amphetamine use per use day in Europe and the authors suggest that it is “broadly
consistent with anecdotal evidence. . . (66).”
Pudney et al. (2006) estimate that 36.7 MT were consumed in 2004 and with approximately 600,000 users in the UK.42 This
equates to approximately 60 grams per user, and assuming 1g per use day this would suggest that the average user used 60
days in 2004. Interestingly, this is similar to the average number of days used for stimulant users (excluding methamphetamine)
in the United States (Mean: 59.11 days, 95%CI: 50.41-67.81). Assuming the same distribution for the United States, the UK,
and the rest of the region, applying the daily use figures for the 95% confidence interval generates a low and high estimate
of 40.3 raw grams (50.41*0.8) and 81.4 raw grams (67.81*1.2), respectively. To generate the largest, but still defensible
range, we use this 81.4 as the high estimate and the 31.6 from the UNODC as the low estimate.
6.2 Number of users and price
In most cases the past-year prevalence figures are from the EMCDDA, but in a handful of cases these numbers were pulled
from the WDR. The figures for amphetamine also include methamphetamine, which really only matters for the Czech Republic
and Slovakia (Pervitin). Most of the price information is obtained from the EMCDDA and when the mean is not listed or is
purely the midpoint, we calculate the geometric mean.43 In some cases, we use price data from the WDR and this is noted
with an asterisk.
6.3 Underreporting
Little is known about underreporting for ATS, but we think it is reasonable to assume that the stigma (and subsequently the
underreporting rate) associated with amphetamines and ecstasy falls between cannabis and powder cocaine/crack. Thus, to
create a range we consider the best for cannabis (20%) as the low estimate and the high estimate for cocaine (50%) as the
high estimate.
6.4 Results
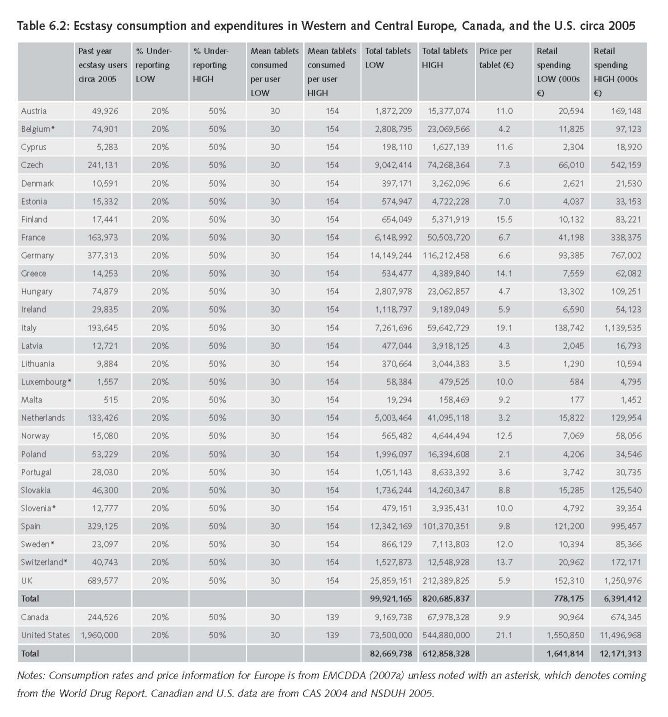
Table 6.2 presents ecstasy consumption and expenditures in Western and Central Europe as well as in the U.S. and Canada
circa 2005.44 The range for total expenditures in Western and Central Europe is €778M-€6,391 M, which comfortably includes
the €2,175 M generated by the UNODC input/output model. Similarly, the range for U.S. and Canada (which account for the
vast majority of ecstasy consumption in North America) ranges from €1,614 M - €12,171 M easily includes the UNODC North
America estimate of €7,522 M. And once again by virtual construction, Pudney et al.’s (2006) best estimates for consumption
(59.5 M tabs) and expenditures (€402 M) fall into the middle of the ranges we produce.
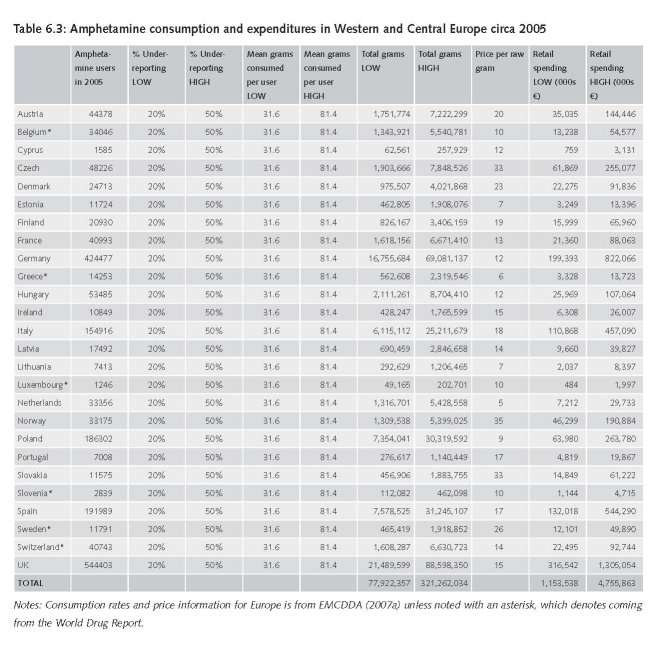
Table 6.3 presents amphetamine consumption and expenditures in Western and Central Europe circa 2005. The range for
total consumption range is 78-321 MT, and for retail expenditures it is €1,154 M - €4,756 M. This range includes the amount
generated for this region by the UNODC input/output model (€1,668 M). And virtually by construction, Pudney et al.’s
(2006) best estimates for consumption (36.7 MT raw) and expenditures (€468 M) fall in the large ranges we produce. That
being said, we are not comfortable using the midpoint or any other figure as the best estimate.
36 It is also unclear how the $63.4 B estimate was estimated. The algorithms used to generate these figures are not listed and the half page of text
that accompanies this table only makes a brief comment about the methodology. For example, the report notes that the average price for pure
methamphetamine at the retail level in North America was $100.10. The formula is not listed, but our calculations suggest that the authors may
have taken the typical price reported in Canada ($87.7) and the United States ($112.5) from the 2008 World Drug Report and calculated the
raw average [$100.10 = ($112.5+$87.7)/2]. This appears to be same methodology used for Eastern Europe ($19; Belarus=$33, Moldova=$5)
and East Asia ($640; Japan=$389.70, Republic of Korea=$892.1). We do not know if this methodology was employed for all regions and
substances, but consumers of this research should know that the results may be different if a weighted average was used to calculate the
regional retail prices. Further, it is also important to note that the regional results will be sensitive to the countries actually included in the calculation
(e.g., based on our calculations it appears that Mexico is not included in the retail price estimates for North America).
37 An entire chapter of the 2005 World Drug Report is devoted to describing the results of the UNODC’s input/output model of the global drug market.
38 While methamphetamine is not popular in Europe, it does have a strong presence in the Czech Republic and Slovakia. According to the
EMCDDA (2008c): “Methamphetamine is the most widely abused synthetic psychotropic drug, particularly in North America and countries of
the Far East. Among European countries, methamphetamine is most frequently consumed in the Czech Republic and in Slovakia, although the
availability or use of the drug is sporadically reported by other countries. In 2006 in the Czech Republic there were estimated to be approximately
17 500–22 500 methamphetamine users (2.4 to 3.1 cases per 1 000 aged 15–64 years) and in Slovakia around 6 200–15 500 (1.6 to 4
cases per 1 000 aged 15–64 years)” www.emcdda.europa.eu/publications/drug-profiles/methamphetamine


6.5 Methamphetamine
This section estimates methamphetamine consumption and expenditures for the household population in the United States.
While methamphetamine is a popular stimulant in much of Asia, the lack of data makes it impossible to generate reliable
estimates for the region.45 First, the UNODC does not distinguish between types of amphetamines for prevalence estimates
in the WDR. Second, it is not clear whether the retail prices reported to the UNODC are for a pure or raw gram. Third,
the price ranges reported for some Asian countries seem extremely large. For example, the retail price range for a gram of
methamphetamine in Japan ranges from €70 to €557 (UNODC, 2008a). Since the retail purity is not reported for Japan and
the typical amount reported is just the midpoint (€313), it is very unclear how much stock we should put into this estimate.
Another example is the Republic of Korea reports a typical gram of methamphetamine costing €720, with a range from
€251 to €921. Fourth, it is unlikely that the consumption patterns are the same across countries given the different incomes.
Thus, future work should focus on generating country-specific estimates in Asia based on country-specific information about
quantity consumed.
Generating estimates for the typical quantity of methamphetamine consumed is not only difficult because of heterogeneity in
purity, but also because most studies do not report whether they are talking about raw or pure grams. Cho & Melega’s (2002)
technical discussion of the pharmacokinetics of methamphetamine suggest that chronic users (“periodic self-administration
throughout the day”) use between 0.7 and 1 grams during a use day and during a binge consumption can range from
2-4 grams (26); however, there is no discussion about whether these are pure grams. But in the same volume, Simon et al.
(2002) present self-report information from a treatment population and note that “used from .5 to 1 gram on a typical (24 hour)
day and spaced out the use to cover the waking hours.” Since the questions did not ask about pure grams and most users do
not know the precise purity of the methamphetamine they consume, we believe that these estimates are for raw grams.
These ranges are consistent with a variety of sources covering different populations:
• There is information from the U.S. National Highway Traffic Safety Administration (no date) suggesting that the typically
abused doses are 100-1000 mg of 60-90% pure methamphetamine: “Purity of methamphetamine is currently very high,
at 60-90%, and is predominantly d-methamphetamine which has greater CNS potency than the l-isomer or the racemic
mixture. Common abused doses are 100-1000 mg/day, and up to 5000 mg/day in chronic binge use.”
• The 100-1000 mg range is consistent with Semple et al.’s (2004) survey results of 194 methamphetamine-using HIV
positive men who have sex with men. Among those who injected methamphetamine, they had used meth on average for
12 days in the previous month and an average of 7.8 grams, for an average quantity consumed per use day 0.65 grams. The
comparable figure for those who used but did not inject was 0.275 grams (8 days and 2.2 grams in the previous 30 days).
Once again, since this was self-reported use by the consumer, it is more likely that they are reporting in raw grams.
• A report from the Canadian Department of Justice (2007) suggests that “Novice users can obtain a high by ingesting
1/8 gram (125 mg) of methamphetamine, while a regular user ingests more to get this effect (250 mg).”46 While this
passage does not indicate that these are daily doses, they are consistent with the NHSTA range and the 250 mg is consistent
with the 275 mg per use day for regular using non-injectors from Semple et al. (2004).
This is also consistent with a report from a non-profit in Oklahoma City (an area with a very large methamphetamine problem)
which suggests that the “typical dosage is anywhere from .2 grams to .4 grams” (Council of Neighborhoods, 2008).
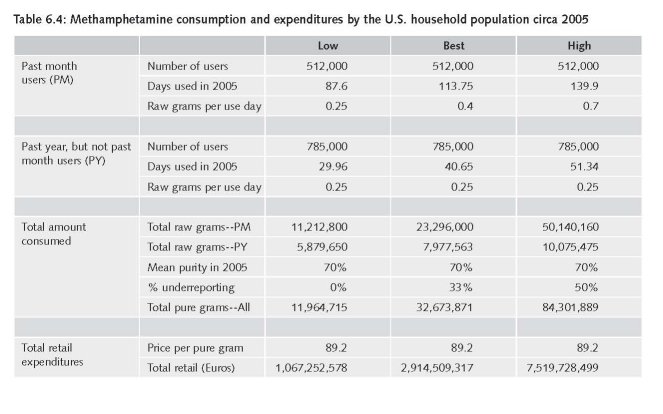
Based on these various sources, it seems reasonable to assume that those who used in the past year but not in the past month
consumed 0.25 grams per use day. We also use this as the low estimate for those who used in the past month. For a best
and high estimate for the past month users we use 0.4 and 0.7, respectively. Since Simon et al. (2002) generated their 0.5 to
1 gram range from a treatment population, we would like the best estimate to be lower than this range. The 0.7 is the lower
bound range for the chronic use described Cho & Melega (2002) and is close to 2 to 3 times the typical dosage.
The prevalence and days consumed in the previous year come from the 2005 U.S. household survey. Harrison et al.’s (2007a)
validity study of those aged 12-25 in the household population did examine stimulants, but they were unable to distinguish
consumption of amphetamines, methamphetamine, and prescription drugs. This, in addition to the small samples (in terms
of positive tests and self reports) led them to conclude that “it is difficult to draw meaningful conclusions about the validity
of self-reported stimulant use.” Since it would be hard to argue that methamphetamine consumption is not as stigmatized
behaviour as cocaine consumption in the United States, it seems reasonable to apply our cocaine inflation factors. The purity
figures come from ONDCP which suggested that meth purity hovered around 70% in 2005. The price estimates were
calculated by RAND to be $107 per pure gram in 2005 and converted to Euros assuming a conversion rate of 1 Euro per
$1.20 in 2005.
Table 6.4 reports the results and our best estimate of methamphetamine expenditures by the U.S. household population
€2.9B. As we would expect, this is lower than the €5.1B estimated by Abt (2001) for 2000 since we do not consider those
not covered by the household surveys. Additionally, our estimates should be lower since the price per pure gram at the
retail level dropped by roughly 50% between 1999 and 2005 (RAND analyses of STRIDE). The ONDCP reports that retail
methamphetamine prices nearly doubled between 2005 and 2006 (ONDCP, 2007), which further highlights the fact that
remarkably different estimates can be generated depending on which year is examined.

39 Pudney et al. (2006) assumed an average purity of 65mg in their calculation of the UK market, which is similar to the low purity estimate offered
by UNODC.
40 Van der Heijden, A.W.M. (2003), De Nederlandse drugsmarkt, Dienst Nationale Recherche Informatie (DNRI), Zoetermeer, November 2003.
41 As noted by Dunn et al. (2007): “Throughout the 1990s, the proportion of amphetamine-type substance seizures that were methamphetamine
(rather than amphetamine sulphate) steadily increased, until methamphetamine dominated the market. In the financial year 2000/01, the vast
majority (91%) of all seizures of amphetamine were methamphetamine (Australian Bureau of Criminal Intelligence 2002). In Australia, the
powder traditionally known as ‘speed’ is generally methamphetamine rather than amphetamine” (p 44).
42 Estimate 544403 for those aged 16-59. Those <=15 and not covered by the household survey likely put this figure above 600,000.
43 The EMCDDA ecstasy prices are consistent with those some of the published qualitative literature. Massari’s (2005) price estimates from the field
in the early 2000s for Amsterdam was €2.5-5 per pill, €6-7 for Barcelona, and €7-15 for Turin. The EMCDDA estimates for 2005 were €3 for the
Netherlands, €10 for Spain, and €19 for Italy.
44 We do not normalize by GDP since we do not generate a best estimate. Those wishing to makes these comparisons for 2005 may consult our Annex 2.
• 12474-
45 Since the meth users in Czech Republic and Slovakia are included in Table 5.3, we do not include them here. Since meth is more expensive and
more addictive than most amphetamine-type substances, the estimates for these countries are probably low, but surely not enough to have a
dramatic impact on the range presented in Table 5.2 (especially given the focus on generating a very large range).
46 www.justice.gc.ca/eng/dept-min/pub/meth/p2.html#1.3
| < Prev | Next > |
|---|


