CHAPTER 1 THE AIDS SITUATION IN CHINA
| Reports - HIV/AIDS in China Report 2007 |
Drug Abuse
CHAPTER 1 THE AIDS SITUATION IN CHINA
I The data in this report does not include Hong Kong, Macao or Taiwan
The Ministry of Health (MOH), UNAIDS and WHO jointly released the '2005 Update on the HIV Epidemic and Response in China'. This showed that HIV was widespread, but with significant geographic differences in the epidemic. HIV prevalence was still expanding with parallel transmission modes, the most important at that time being injecting drug use and sexual transmission. Moreover, the situation in terms of people living with HIV (PLHIV) developing AIDS and AIDS-related deaths had become serious. There was evidence that the epidemic was spreading from high-risk groups to the general population, creating the potential risk that the epidemic would spread further.
In the past two years, progress has been made in strengthening surveillance, case reporting systems, expanding voluntary counselling and testing, addressing comprehensive prevention interventions, treatment and care, and strengthening international cooperation.
Particular attention has also been given to strengthening epidemiology parameters, size estimation of the most-at-risk populations (MARPs) and estimation and projections of the epidemic. These measures have strengthened knowledge of the current AIDS situation in China. The results of the reporting information system, sentinel surveillance data, behavioural surveys, specific investigations and the 2007 estimation of the HIV epidemic are presented in the following sections.'
1.1 Reported HIV Infections
1.1.1 Overall trends
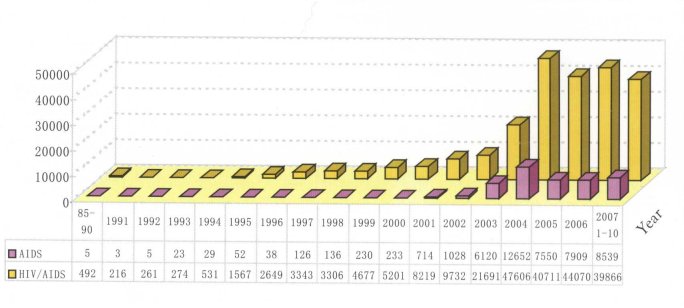
By the end of October 2007, the cumulative total of reported HIV positives was 223,501, including 62,838 AIDS cases and 22,205 recorded deaths.
From January to the end of October 2007 the number HIV positives reported was 39,866, including 8,539 AIDS cases and 4,232 deaths. Figure 1.1 shows the annual reported HIV positives and AIDS cases in China since 1985. The large increase in HIV positives shown for 2004 is mainly due to intensive screening of former blood donors and expanded and strengthened surveillance and testing.
Figure 1.1 Annual reported HIV positives and AIDS cases in China 19852007
1.1.2 Geographic distribution
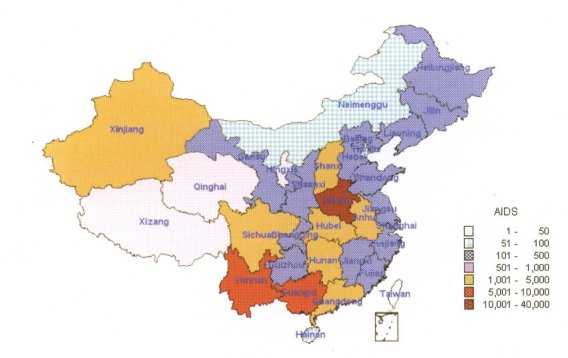
The cumulative number of people living with HIV in Yunnan, Henan, Guangxi, Xinjiang, Guangdong and Sichuan accounts for 80.5 per cent of the total reported numbers in China (see Figure 1.2). The number of AIDS cases in Henan, Yunnan, Guangxi, Anhui, Guangdong and Hubei accounts for 83 per cent of the total reported number (Figure 1.3), while the number of AIDS-related deaths in Henan, Yunnan, Guangxi, Hubei, Anhui, Guangdong and Sichuan accounts for 80.5 per cent the total.
Figure 1.2 Geographic distribution of cumulative reported HIV positives in China (as of October 2007)
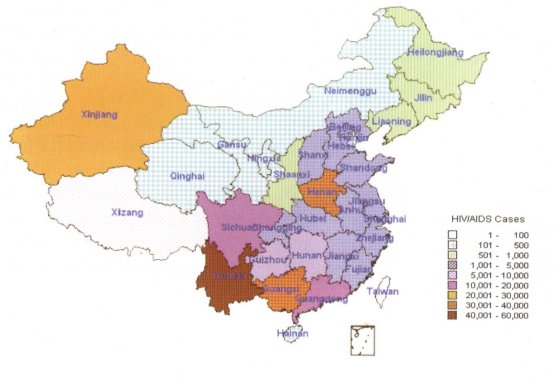
Figure 1.3 Geographic distribution of cumulative reported AIDS cases in China (as of October 2007)
1.1.3 Transmission mode
By the end of October 2007, among the cumulative number of PLHIV, 38.5 per cent were infected via injecting drug use (IDU), 19.3 per cent was via former blood and plasma collection, 17.8 per cent was through heterosexual transmissions, 1 per cent through homosexual transmission, 4.3 per cent via blood transfusion and blood products, and 1.2 per cent through mother-to-child transmission (MTCT). The transmission mode for the remaining 17.9 per cent is unknown.
Among those living with HIV reported between January and October 2007, 37.9 per cent was through heterosexual transmissions, 3.3 per cent through homosexual transmission, 29.4 per cent were infected via IDU, 6.1 per cent was via blood and plasma collection, 4.2 per cent via blood transfusion and blood products, and 1.6 per cent through MTCT, with 17.5 per cent unknown.
1.1.4 Age distribution
Cumulative cases by the end of October 2007 showed that HIV infections are concentrated in the 20 to 39 age group, who account for 70 per cent of the total. AIDS cases are mainly aged between 20 and 49, this group accounting for 69.9 per cent of the total and AIDS-related deaths are also concentrated in this age group (72 per cent of the cumulative deaths).
Table 1.1 Age distribution of HIV infections, AIDS cases and AIDS-related deaths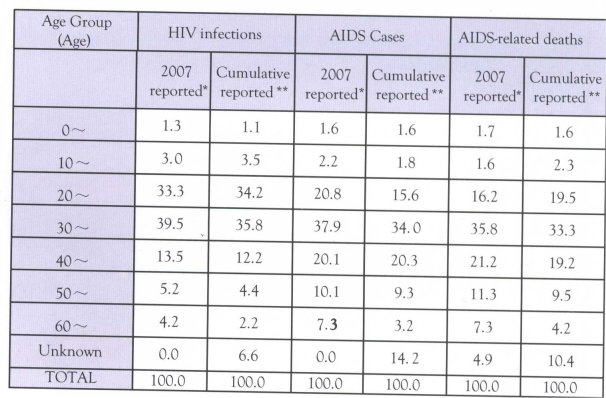 3
3
"HIV infections, AIDS cases and AIDS-related deaths reported during January to October 2W7;
** Cumulative HIV infections, AIDS cases and AIDS-related deaths by end of October 200Z
Note: HIV infections means those who have been infected by HIV but has not developed into AIDS
1.1.5 Gender distribution
By the end of October 2007, 71.3 per cent of the cumulative total of PLHIV was male and 28.7 were female. Among the AIDS cases 60.6 percent were male and 39.4 per cent female.
Among the HIV infections reported between January and October 2007, 70.5 per cent was male and 29.5 were female. Among the AIDS cases 64.7 per cent were male and 35.3 per cent female.
1.2 The 2007 AIDS Epidemic Estimation
In 2007 MOH, UNAIDS and WHO have prepared this updated assessment of the AIDS epidemic in China.
1.2.1 Key findings of estimation
Number of people living with HIV: The estimation results indicate that by the end of December 2007, the current HIV positives were approximately 700,000 (range 550,000-850,000). The proportion of females is 30.8 percent. The HIV infection rate among China's population is 0.05 per cent (range 0.04-0.07%). The estimated number of AIDS cases is 85,000 (range 80,000-90,000). The estimated new HIV positive cases in 2007 were 50,000 (range 40,000-60,000) and there are an estimated 20,000 AIDS-related deaths (range 15,000-25,000).
Distribution characteristics: Of the 700,000 HIV positives still living, 40.6 per cent were infected through heterosexual transmission, and 11.0 percent through homosexual transmission. Heterosexual transmission was mainly focused in high prevalence provinces. Homosexual transmission was mainly focused in large and middle-sized cities and areas with large concentrations of migrants.
Among the estimated HIV positives, 38.1 per cent were infected through IDU. There are seven provinces and autonomous regions in which the number of HIV positives infected through IDU is over 10,000; namely Yunnan, Xinjiang, Guangxi, Guangdong, Guizhou, Sichuan and Hunan. These provinces contain 87.9 per cent of people infected through IDU.
Also among the estimated 700,000 HIV positives, 9.3 per cent were infected through commercial plasma donation and transfusion of infected blood and blood products. Of these 87.6 per cent were located in four provinces: Henan, Anhui, Hubei and Shanxi. Just 1 per cent of infections were through MTCT.
Among the estimated living 85,000 AIDS cases, some 35,000 are former commercial blood donors and people infected through blood transfusion. The remainder (50,000) were infected through IDU, sexual and mother-to-child transmission.
New infections in 2007: It is estimated that there were 50,000 new infections in 2007, mainly concentrated among injecting drug users (IDUs), sex workers (SWs) and their clients, men who have sex with men (MSM) and the partners of HIV positive people.
1.2.2 Comparison with 2005
The estimated number of people infected with HIV through heterosexual transmission increased by 50,000 in 2007 compared with 2005. In addition estimates the HIV prevalence rate among the clients of sex workers increased 1-2 percent over the figure for 2005.
In 2007 the HIV positives among MSM was about 30,000 more than the 2005 estimate. This was primarily due to the availability of more up-to-date estimates of the MSM population size and prevalence data for the past two years. The new estimation better represents the actual situation than the previous estimation.
The estimate of HIV positive people among IDUs decreased by more than 20,000 compared with the 2005 figure. This is primarily due to more complete and accurate information on the IDU population through more intensive screening for HIV among this group. The lower end of the estimated IDU population range for 2007 is only 86 per cent of the low range figure used for the 2005 estimation.
The estimate of HIV positive people among the former blood and plasma donors was 12,000 less than the 2005 estimation. This is mainly due to enhanced screening and better estimation of the size of this population.
1.3 Characteristic of the Epidemic in China
1.3.1 The epidemic continues to expandbut the rate is slowing
The epidemic estimation results show the number of PLHIV has increased by 50,000 since 2005 and the AIDS cases has increased from 75,000 to 85,000 in 2007. The number of new infections is estimated at 50,000, which is 20,000 less than the 2005 figure.
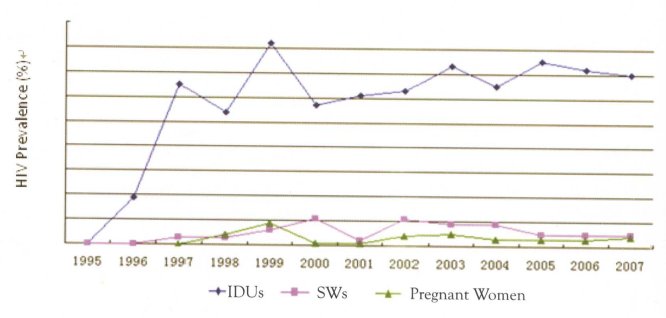
Sentinel surveillance data shows that the infection rate among IDUs, SWs and pregnant women continues to increase, but the rate of increase has slowed as indicated in Figure 1.4.
Figure 1.4 Sentinel surveillance data on IDUs, sex workers and pregnant women
1.3.2 Sexual transmission is now the main mode
Among the 50,000 estimated new infections during 2007, heterosexual transmission was 44.7 per cent, homosexual transmission was 12.2 per cent and transmission through IDU was 42 per cent, while MTCT transmission was 1.1 per cent.
Among the transmission modes, the ratio of sexual transmission is increasing each year. Heterosexual transmission was 10.7 per cent of the total in 2005 and reached 37.9 per cent in 2007. Similarly, homosexual transmission was 0.4 per cent in 2005 and showed a dramatic increase to 3.3 per cent in 2007 (Figure 1.5).
The cumulative transmission mode for HIV positives at the end of 2006 and for the period January to October 2007 is given in Figure 1.6.
Figure 1.5 Distribution of sexual and IDU transmissions of HIV from web-based
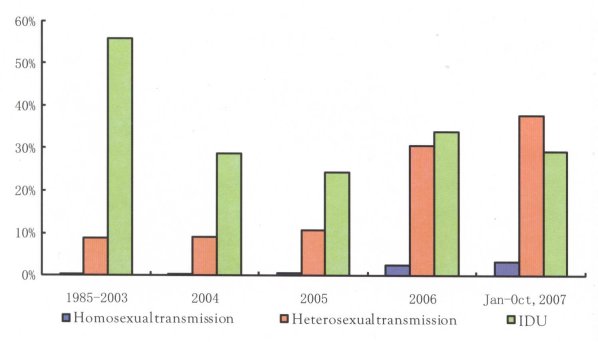
Figure 1.6 Transmission mode distribution among reported HIV positives in 2007 and cumulative reported cases by the end of 2006

1.3.3 Geographic distribution is highly varied
Since 1998 all 31 provinces, autonomous regions and municipalities have reported HIV cases. By October 2007, 74 per cent of counties/districts reported HIV positive people. The web reporting data shows great differences in reported cases between different localities. The top five provinces of reported HIV positives account for 70-80 per cent of the total national reported cases (see Figures 1.2 and 1.3).
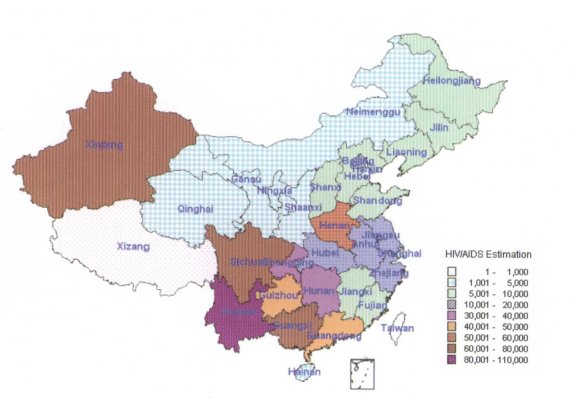
The 2007 epidemic estimation shows five provinces with more than 50,000 HIV positives and nine provinces with 10,000-50,000 PLHIV. Only four provinces have less than 2,000 PLHIV. The top five provinces account for 53.4 per cent of the national estimated number, while the bottom five provinces only account for 0.9 per cent of the total (see Figure 1.7).
Figure 1.7 Geographic distribution of 2007 estimated cases
1.3.4 Factors driving the epidemic
Comprehensive surveillance data shows that 40 per cent of IDUs share needles, while 60 per cent of sex workers do not use condoms every time. Risky behaviour among MSM includes 70 per cent of the group having sex with more than one partner in the past 6 months and only 30 per cent use condoms for anal sex, while 50 per cent use condoms when they have commercial homo-sex.
Reported cases and epidemic estimation show that about 500,000 PLHIV have not been identified, while among the 220,000 reported PLHIV the follow-up rate is low due to the high mobility of the individuals and other difficulties in tracking and follow-up. The high proportion of PLHIV who do not know their status and the difficulties of following-up HIV positives are major risk-factors behind the potential for the further spread of infections.
In recent years the prevalence rate of syphilis has increased rapidly demonstrating the re-emergence of an epidemic. The national syphilis reported incidence rate increased from 0.08 per 100,000 in 1987 to 13.3 per 100,000 in 2006, an annual rate of increase of 30.7 per cent. Sexually transmitted infections (STI) sentinel monitoring reporting shows 28.9 percent of sites identified PLHIV.
Stigma and discrimination of PLHIV remains a serious problem. Because of this, individuals with high risk behaviour avoid voluntary HIV testing and PLHIV are afraid to disclose their HIV status. This increases the risk of HIV spreading further.
1.4 Impacts of AIDS
In high-prevalence locations there are apparent social impacts due to AIDS, but data from applied research surveys on the social and economic impacts of AIDS is limited.
1.4.1 Impact of AIDS on well-being of individuals
National infectious disease statistics show that, in 2006, fatality rate of AIDS cases was 20 per cent, the third highest fatality rate among national infectious diseases (class I and II). The mortality rate of AIDS is 0.1 per 100,000, which ranks AIDS as number four nation-wide. These deaths mainly focused on the working age group (nearly three-quarters of the 20-49 age category), with an average death age of 37.6.
1.4.2 Impact of AIDS onmental health
Field investigations show that two-thirds of PLHIV experience severe depression and may consider suicide, although few do. Nearly 70 percent of children lost hope for the future and self-value recognition when they knew their parents developed AIDS symptoms. Several case studies show that children affected by AIDS in some communities are unable to attend school or community activities.
Stigma and discrimination against PLHIV is severe. Field investigations showed nearly 40 per cent of people shun contact with PLHIV.
1.4.3 AIDS impact on households
The economic impacts of families can be significant as fewer members are available for income-generating activities and finances are diverted to treatment and care of AIDS patients. For instance, a study found that the average income per person in households affected by AIDS was 44 to 47 per cent,of persons in families not affected by AIDS. In some areas PLHIV need to pay additional cost, such as treatment for opportunistic infection (01), which increase the economic burden for families affected
by AIDS.
The care of PLHIV mainly relies on local government welfare payment, but migrants have difficulty in obtaining care and support.
| < Prev | Next > |
|---|


