Chapter 12 Global cannabis cultivation and trafficking
| Manuals - Cannabis Reader |
Drug Abuse
Keywords: cannabis — cannabis herb — cannabis resin — cultivation — demand — prices — seizures — supply — trafficking
Setting the context
Sizing markets for illicit products is always difficult. The most basic challenge is that the standard yardsticks common for legal markets cannot be used. Analysis and forecasts are simply not available for illicit goods, and economists working on the issue are faced with a lack of standard sources such as investor reports, tax declarations and fiscal yields, obligatory bourse filings, performance indicators, customs duties, wholesale and retail reports and the trade press.
So drug market analysts must instead make do with a piecemeal substitute, triangulating information obtained from various channels: enforcement (police reports, crime statistics, customs seizures data), healthcare (drugs epidemiology, treatment indicators) and a more nebulous literature base produced by drugs workers and charities, think tanks, academics and policymakers, and journalists. While in some cases, statistics are produced on a standard, usually annual cycle (United Nations Office on Drugs and Crime (UNODC), EMCDDA, World Customs Organisation, Interpol), more often than not analysis is ad hoc and restricted in scope, for example national, regional or single-theme studies.
UNODC is the primary provider of research into the machinations of the global illicit drugs market. In this chapter, UNODC authors reveal that, for cannabis, estimating supply is even more difficult than for other drugs, such as heroin and cocaine. For example, while satellite data have recently been used to estimate areas of cultivation in a report on Morocco, there is strong variation in crop yields and the cost of expanding such scrutiny on a global level is prohibitive. Another difficulty is that supply is moving closer to the consumer. As indoor cultivation, self-supply and locally grown herbal cannabis become more common, the likelihood of seizures providing a complete picture of the market decreases. Beyond this, there is also considerable variation in how herbal cannabis and cannabis resin seizures are reported, a fact further impacted by the relatively low standardisation of information on the product itself (e.g. resin or herb, potency and estimated dose consumed by users).
Nonetheless, this chapter points out that indicators suggest that worldwide cannabis cultivation increased throughout the 1990s until 2004, in keeping with growing demand, both at the global level and in Europe. Only in 2005 was a reduction reported. For herbal cannabis, North America remains the largest market and is largely self-contained. For cannabis resin, Europe remains the largest consumer market, predominantly supplied by Morocco (see also GameIla and Jiménez Rodrigo, this monograph), even though Morocco's importance as a source country for cannabis is declining. Despite some progress made in recent years, there can be no doubt that more research and better official record-keeping are required to provide more precise estimates on the total amount of cannabis grown and consumed globally. And while work is taking place — some European countries are modelling consumption patterns for intensive cannabis use (EMCDDA, 2007) — this chapter offers practical suggestions for improving our knowledge of the market.
Further reading
Ben Lakhdar, C. (2007), Le trafic de cannabis en France, OFDT, Paris.
EMCDDA (2007), Annual report 2007: the state of the drugs problem in Europe, European Monitoring Centre for Drugs and Drug Addiction, Lisbon.
Hough, M., Warburton, H., Few, B., May, T., Man, L-H., Witton, J., Turnbull, P. (2003), A growing market, the domestic cultivation of cannabis, Joseph Rowntree Foundation, Homestead.
Jansen, A. (2002), 'The economics of cannabis-cultivation in Europe', paper presented at the 2nd European Conference on Drug Trafficking and Law Enforcement, Paris, 26-27 September.
Leggett, T. (2006), 'Cannabis: why should we care?', Chapter 2 of World Drugs Report 2006, UNODC, Vienna.
van Solinge, T. (1998), 'Drug use and drug trafficking in Europe', Journal of Economic and Social Geography 89(1): 100-105.
UNODC (2005), 'Estimating the value of illicit drug markets', Chapter 2 of World Drugs Report 2005, UNODC, Vienna.
UNODC (2007), 'Chapter 1.4: Cannabis market', in World Drugs Report 2007, UNODC Vienna.
Global cannabis cultivation and trafficking
Ted Leggett and Thomas Pietschmann
Abstract
Though cannabis is, by far, the most widely used illegal drug worldwide, consumed by some 3.8% of the population aged 15-64 in 2005-2006, little scientific information is available on the actual extent of its cultivation and its yields. Information collected by UNODC indicates that it is produced in (at least) 172 countries across the globe. UNODC's best estimates, based on Member States' estimates and some indirect measurement techniques, suggest that some 42000 tonnes of cannabis herb and 6600 tonnes of cannabis resin were produced at the global level in 2005, slightly down from the peak in 2004, though still significantly more than in the early 1990s. This pattern is in line with global cannabis herb and resin seizures and global cannabis consumption estimates. The largest cannabis herb seizures have been reported from North America (Mexico, followed by the USA), followed by Africa and South America. The largest cannabis resin seizures have been reported from Western Europe (notably Spain), followed by countries of South-West Asia (Pakistan, Iran and Afghanistan) and North Africa (Morocco). Production of cannabis resin in Morocco, the world's largest cannabis resin producer and main supplier of it to Europe, has been declining since 2004, while production in Afghanistan is increasing. The chapter also makes a number of proposals on key areas where more research is needed.
Strong increases in global cannabis cultivation have been reported over the last four decades, largely related to rising demand in North America, Europe and Australia. Increased production occurred first in the traditional cannabis-producing countries and, more recently, in the developed countries that provide the most lucrative consumer base. Only in 2005 were the first signs of a decline in global cannabis production seen, following years of continuous increases in the 1990s and in the early 2000s.
It remains difficult to establish how much cannabis is produced globally. Unlike other drug crops, cannabis is a plant that can be grown in virtually every inhabited region of the world, and can be cultivated with little maintenance in small plots, or even indoors. UNODC regularly collects, mainly using its Annual Reports Questionnaire (ARQ), estimates from UN Member States on the areas under cannabis cultivation and estimated yields. But reliability of these figures is significantly lower than the corresponding estimates for heroin or cocaine, which are typically made using satellite photos and scientific yield assessments.
Heroin and cocaine production estimates are facilitated by the fact that production of opium and of coca leaf is nowadays geographically concentrated in just a few areas. A global assessment of cannabis cultivation, in contrast, would have to be truly global, and would be both extremely difficult and expensive. An idea of the costs involved can be derived from UNODC's work in this area. UNODC has conducted studies of the extent of cannabis cultivation in Central Asia in the late 1990s and, in collaboration with the government of Morocco, of the primary cannabis-producing areas of that country in 2003, 2004 and 2005. The latter studies employed the use of remote sensing technology as well as ground survey data. Conducting such comprehensive surveys in countries the size of Morocco would probably cost between USD 200 000 and USD 300 000 per country. While Morocco actually covers a large part of the survey costs, many other countries would not be in a position to do so, which would leave the costs with the international community.
Even if the precise number of hectares dedicated to cannabis cultivation worldwide could be determined with the help of remote sensing technology, estimates of crop yields would still be a challenge. Although cannabis can be grown in most countries, its productivity is directly linked to growing conditions, and cannabis is a highly adaptable plant. Depending on the cultivar and the environment in which it grows, cannabis can vary in appearance from a small weed to a substantial bush to a five-metre tree (Clarke, 1981).
Yield estimates provided by Member States to UNODC ranged from as low as 5 kg per hectare for wild cannabis to 17 500 kg per hectare for countries that reported a high proportion of hydroponically grown cannabis. The median cannabis yield was 730 kg per hectare, and the unweighted average yield was 2 070 kg per hectare (UNODC, 2007). Moreover, cannabis can be 'adulterated' considerably by the inclusion of inert (or relatively inert) plant material. All of this makes coming up with an estimate of yield per plant or per unit area (square metre or hectare) a difficult exercise. Yield estimates must also take into consideration whether the plants in question were intended to be used for cannabis herb or resin production. Cannabis can be consumed with little processing after harvesting. As a result, users can feasibly cultivate their own supply, and production is highly decentralised. While substantial international trafficking of cannabis does occur, it is unclear what share of the total market this comprises. It appears that many countries can satisfy much of domestic demand with locally produced cannabis (see Korf, this monograph), and this trend appears to be growing in many important markets.
The matter is complicated further by the fact that cannabis comprises two distinct drug products, cannabis herb and cannabis resin. Over the period 2000-2005, 82% of the cannabis end-product seizures concerned cannabis herb and 18% cannabis resin (UNODC, ARQ). Herbal cannabis comes in various grades, including a product made up of only the unfertilised buds of the female plant, known as sinsemilla. There are also various grades of hashish, based on amount of impurities contained in the final product. In addition, it is possible to produce 'cannabis oil', although this form of the drug is not widespread: 0.02% of global seizures of cannabis end-products over the 2000-2005 period, and only 0.01% in 2005.
While herbal cannabis is consumed throughout the world, the largest market for cannabis herb is in North America, where 63% of global seizures occurred in 2005, followed by Africa (18% in 2005). Europe accounted for just 2% of global cannabis herb seizures in 2005, down from 4% in 2000 (UNODC, ARQ). Changes in law enforcement priorities among some European countries may also have played a role here.
Western Europe is the largest market for cannabis resin, responsible for more than 70% of global seizures in 2005. UNODC estimates that around 70% of this hashish was produced in Morocco in 2006, down from some 80% in previous years (UNODC, 2007). In 2003, France reported that 82% of the cannabis resin found on its market in 2002 originated in Morocco. Similar estimates were made for Belgium (80%), Sweden (85%), and the Czech Republic (70%). Spain, Italy, Denmark, Finland and Ireland
reported that almost all of the cannabis resin originated in Morocco (UNODC, 2006). By 2005-2006, most European countries reported a decline of the importance of Moroccan cannabis resin. Based on individual drug seizure data provided by the World Customs Organisation (WCO) to UNODC cannabis from Morocco accounted for, in weight terms, 74% of total cannabis resin seizures made in Western Europe in 2006, down from 82% in 2004. In terms of number of seizure cases, the proportion of Moroccan cannabis fell to 67% by 2006, according to WCO data. All of this reflects an underlying decline of cannabis resin production in Morocco in recent years.
While UNODC relies primarily on official government figures for its global estimates, these estimates are not available for all cannabis-producing countries in the world. Only a few countries have scientifically valid estimates based on remote sensing technology or based on ground surveys. Most countries provide estimates based on some extrapolations from their cannabis eradication activities. Where official figures for cannabis herb production are not available, UNODC bases its estimates on demand data, also taking police intelligence into account. Law enforcement information is often available with regard to a country's position as a cannabis production, transit or export country. For countries that are neither importing nor exporting countries, it can be assumed that domestic demand is covered by domestic production. For cannabis importing countries, there are usually rough estimates available on the share of imported cannabis. Similarly, for cannabis exporting countries there are rough estimates available on the proportion of cannabis produced for local production and for export. Based on such information and estimates on the size of the local cannabis market, likely orders of magnitude of domestic cannabis production can be established.
This approach, of course, is not without difficulties. Survey data on cannabis use are also not available for all countries. In such cases, the sub-regional prevalence rates are used as a proxy. Even where available, many important questions may remain unanswered, particularly with regard to the quantities of cannabis consumed per user. Where these figures are available, the reliability of such consumption estimates can still be questioned. Even for experienced users, estimating total consumption can be difficult: cannabis is often smoked communally, with many consuming less than a whole 'unit' in a single session of use. Use levels also vary based on drug availability and potency.
Despite these difficulties, available data show some general trend patterns. Most available indicators suggest that cannabis production, after having fallen in the late 1980s (mainly due to large-scale eradications in Latin America), rose again in the 1990s and continued rising in the new millennium until 2004 before falling back in 2005. Similarly, the volumes of cannabis seized by customs and the police have been increasing from the early 1990s until 2004 at the global level before declining strongly in 2005. Drug use surveys also show that global demand increased until 2004 before declining in 2005. An estimated 159 million people, or 3.8% of the population age 15-64, used cannabis at least once in the 12 months prior to the survey(s) in 2005-2006, down from 162 million people in 2004. This figure for 2005-2006 is, however, still some 10% higher than for the late 1990s (144 million people in 1997-1998) (UNODC, 2007). Despite the decline in 2005, consumption estimates and expert opinions solicited from UN Member States suggest that cannabis use has been growing faster than the use of cocaine or opiates over the last decade (UNODC, 2007).
To keep up with growing demand, either more land area would have been needed for the crop, or technological innovation would have been required to make cannabis production more efficient. Both factors seem to have played a role in increasing supply over the last decade. In fact, in addition to some expansion in the area under cultivation, great strides have been made in improving cannabis plot productivity, particularly indoors in developed countries.
Cannabis herb production
As argued above, the unique properties of the cannabis plant have led to its widespread and diffuse cultivation. Over the 1995-2005 period, 82 countries provided UNODC with cannabis production estimates. For comparison, only 46 countries provided estimates for opium-poppy cultivation, and only five provided estimates for coca-leaf production (DELTA, 2007). But the fact that a country did not provide an estimate does not mean that no cultivation exists, as some countries simply lack the capacity to come up with estimates. However, there are also some other ways of identifying cannabis-producing countries.
UN Member States — as part of the ARQ — are asked to identify the source(s) of the cannabis consumed in their countries. While this anecdotal evidence is basically opinion data, it is often based on considerable experience in the field, and its value should not be underestimated. On this basis, 134 producer countries could be identified as likely cannabis producers (UNODC, 2007). A third list of producer countries can be generated by singling out those that report the seizure of whole cannabis plants. It is extremely inefficient to transport whole plants internationally, as only certain parts are useable as a drug. Thus, when a whole plant is seized, it is very likely that it was locally produced. Seizures of whole cannabis plants were reported in 146 countries during the 1995-2005 period. Combining these three lists results in the identification of 172 countries and territories where cannabis is produced, out of 197 countries reporting (87%) (UNODC, 2007).
Of course, evidence of some cultivation does not mean the practice is large in scale. Many of these 172 countries seem to produce primarily to satisfy local demand, but there are a number of countries that produce for mass export.
For example, Paraguay produces much of the cannabis consumed in its neighbouring countries, and European production hubs include Albania and the Netherlands. Other significant exporters include:
• in Africa: Nigeria, South Africa, Malawi, Lesotho and Swaziland;
• in the Americas: Mexico, Canada, Jamaica and Columbia;
• in Central Asia: Kazakhstan and Kyrgyzstan;
• in the Middle East: Egypt and Lebanon;
• in South Asia: India; and
• in South-East Asia: Cambodia, Thailand and the Philippines.
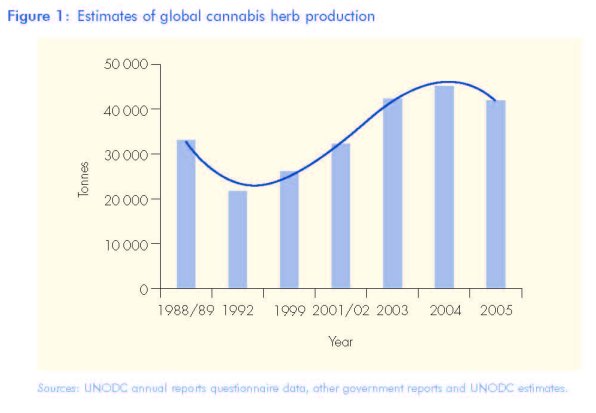
Quantifying this production is another matter. As discussed above, estimating the volume of global cannabis production is extremely difficult. The 2004 World Drug Report (WDR) provided an estimate of about 32 000 tonnes of cannabis herb production at the global level for 2001-2002. The 2005 WDR estimated global cannabis herb production to have amounted to 42 100 tonnes in 2003. Since the methods used in arriving at these two calculations were not identical, this should not be interpreted as a dramatic increase in just two years. Excluding demand-based production estimates, introduced for the first time in the 2005 WDR, the global estimate would have still increased to around 35 000 tonnes for 2004. Applying the revised methodology, as developed for the 2005 WDR, the 2006 WDR saw a further increase from 42 100 to 45 000 tonnes in 2004. The upward trend, however, did not continue for the subsequent year. Without any further change in methodology, the 2007 WDR saw a decline to 42 000 tonnes in 2005 — the first decline in several years — mainly due to declines reported from North America and Africa, while production continued to rise in many other parts of the world. Despite this decline, production is still higher than a decade ago (Figure 1).
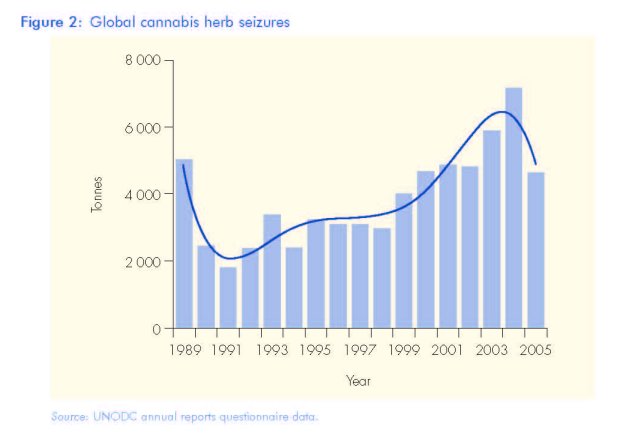
There are also other indications suggesting that global cannabis production has been increasing over the last decade before falling in 2005. Estimates of the number of cannabis consumers globally (based on survey data) and information on the quantities of cannabis seized globally by law enforcement have shown increases until 2004 and a decline in 2005. Where prevalence data and seizure data are available, such as in the USA, a strong correlation between the two datasets was identified in the past, suggesting that cannabis seizure statistics, in general, do reflect consumption trends rather well. The same is true, if looked at from a global perspective, for cultivation and production trends (UNODCCP, 1999) (Figure 2).
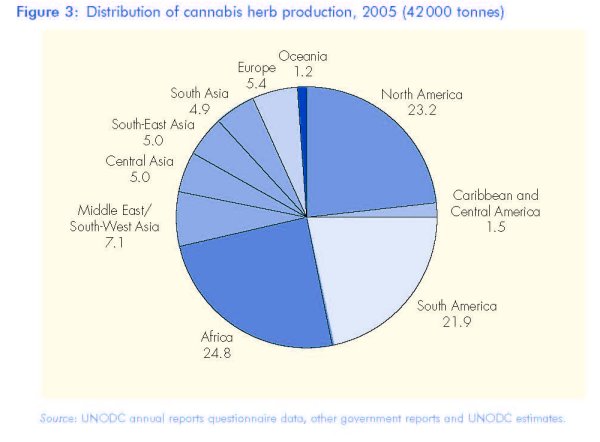
In terms of distribution, estimates made available to the UNODC suggest that the Americas account for some 47% of global cannabis herb production. About half of this, or close to 10 000 tonnes, is produced in North America. The second-largest producer is Africa, accounting for some 25% of global production. Asian countries account for about 22% of global cannabis production. Most of the cannabis in Asia is produced in South-West Asia and the Middle East. Production in Europe, estimated at less than 2 300 tonnes, accounts for 5% of global cannabis herb production.
As mentioned above, all of these must be considered as tentative estimates. For instance, for the USA, one of the best studied countries in the world, estimates based on cannabis eradication data ranged from 5 600 tonnes to 16 700 tonnes (Drug Availability Steering Committee, 2002) in 2000/2001 while demand-based estimates suggested production figures of around 1 000 tonnes (ONDCP, 2000). Eradication-based production estimates for 2006 ranged from 5 650 to 9 420 tonnes, with a mid-range estimate of some 7 530 tonnes. Estimates of net production (after eradication) ranged from 2 830 to 6 590 tonnes with a mid-range estimate of 4 710 tonnes for the USA in 2006 (US Department of Justice, 2007) (Figure 3).
There has been some debate as to whether potency has increased in recent decades. This debate is complicated by the fact that comparable potency data are available for only a small number of countries throughout the world. A review of the potency evidence in Europe was undertaken by EMCDDA in 2004 (see King, this monograph). It remained sceptical about overall increases in Europe. Unfortunately, this analysis conflated herbal and resin markets.
In fact, the potency of cannabis resin — which is mainly imported into Europe from Morocco — seems to have remained stable. However, there is strong evidence that herbal cannabis, which appears to be growing in popularity in a number of European countries, is becoming more potent, largely due to the increasing availability of indoor-produced sinsemilla, a trend seen both in Europe and in other developed countries.
For example, Dutch sinsemilla, which accounts for the bulk of the cannabis market in the Netherlands, doubled in potency in just five years, from about 9% in 1999/2000 to about 18% in 2004-2005 (Niesink et al., 2005). In Germany, the European country
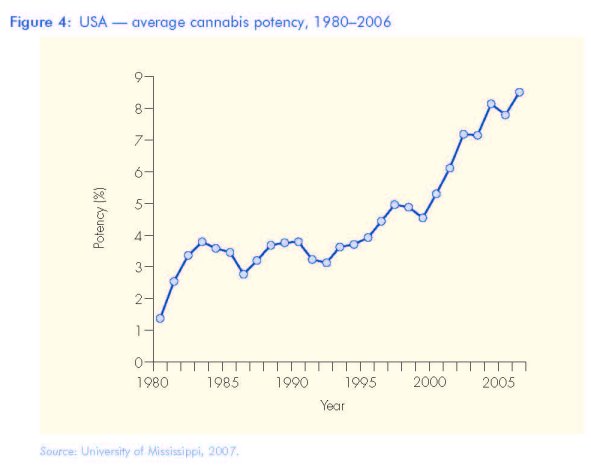
with the largest sample base, no distinction is made between sinsemilla and commercial cannabis. Despite this, aggregate herbal potency has doubled in less than a decade. In 1996, samples averaged about 5%, rising to about 11% in 2004. (Bundeskriminalamt, 2005). In the United Kingdom, sinsemilla potency doubled between 1995 and 2002, from about 6 to about 12% (King et al., 2004). In the other two countries for which comparable data are available, the USA and Canada, cannabis potency is also increasing (Second Technical Conference on Drug Control Research, 2004). In the USA, the Cannabis Potency Monitoring Project found an increase in the average potency of cannabis from less than 2% in 1980 to around 4% in the late 1980s, around 5% in
the late 1990s and 8.5% in 2006 (1). This total included an average sinsemilla potency of over 14% in each year since 2002, up from 8% in the mid-1980s (University of Mississippi, 2007) (Figure 4).
Increases in potency may be also linked to a growing share of the herbal cannabis market in developed countries being produced domestically, with a declining share being the relatively low-potency product traditionally imported from developing countries. In the United Kingdom, it is estimated that as much as half the cannabis consumed is domestically grown, and this share has been on the increase in recent years (Hough et al., 2003). In Iceland, 'domestically cultivated marijuana has become increasingly competitive with imported marijuana, and current estimates indicate it makes up anywhere from 10 to 50 percent of the total cannabis market' (INCB, 2005). Again, this trend appears to be occurring in a number of other developed countries as well. In 1986, it was estimated that one-sixth of cannabis consumed in the USA was produced within the country (President's Commission on Organized Crime, 1986), whereas more recent estimates are closer to a third (Williamson, 2005), and it would appear that this trend is continuing (National Drug Intelligence Center, 2005 and 2007). In Canada in 1985, only 10% of the cannabis consumed was produced domestically (Stamler et al., 1985), but by 2002 it was estimated that 'well over half' was Canadian grown (RCMP, 2002).
In most developed countries, an increase in the share of domestic production means an increase in the share of indoor production, and thus an increase in sinsemilla in the market (2). Unfortunately, time-series data on the share of the herbal cannabis market commanded by sinsemilla in Europe are scant. In discussing the results of their surveys of regular cannabis users, Atha et al. concluded that 'skunk (sinsemilla) was the only type of herbal cannabis to improve its market share in the United Kingdom between 1994 and 1997, up just under 10% (Atha, 2002). Sinsemilla is now said to comprise about half of the United Kingdom and Irish herbal markets (King et al., 2004). Outside Europe, the share of eradicated cannabis cultivation operations that are located indoors in the USA has increased in recent years, from 2% indoor in 1985 (DEA, 2005) to more than 6% in 2005 (National Drug Intelligence Center, 2006). According to the US National Drug Threat Assessment 2005, the prevalence of sinsemilla is continuing to grow in the USA (National Drug Threat Intelligence Center, 2005). In Canada between 1997 and 2000, some 78% of cannabis production operations detected in British Columbia, which produced over 40% of the detected cultivation operations in Canada, were indoors. The number of detected indoor operations tripled during the same time period (Plecas et al., 2002). On a national level, a slightly lower share of all operations detected were indoors (RCMP, 2002). In New Zealand, the number of national survey respondents who had ever used 'skunk' increased from 10% in 1998 to 14% in 2001 (Wilkins et al., 2002). After many years of winning market share from both imports and a remarkable outdoor industry, hydroponic production is now also the most commonly detected method of cultivating cannabis in Australia (Australian Crime Commission, 2004, reconfirmed in Australian Crime Commission, 2007).
Cultivation for personal use is also a significant source of supply in many areas, and in many developed countries this is likely to mean indoor cultivation. In the United Kingdom, one study found that 63% of a sample of regular users reported having grown the drug at some point in their lives, growing an average of 24 plants. The authors estimated that 30% of the cannabis used by regular users in the UK was homegrown in 1997 (Atha et al., 1999). In Spain, legal constraints on carrying — but not consuming — cannabis have led to an increase in production for personal consumption since 1992 (GameIla and Jimenez Rodrigo, 2004). Cultivation for personal use is also common outside Europe, in Oceania, for example. In New Zealand, a household survey found that 10% of all current users grew at least some of their own supply (Wilkins et al., 2002). The share of people cultivating for personal use is much higher among those who use the drug frequently. A survey of regular users in Australia found that two-thirds of respondents grew some cannabis for their own use, and nearly half grew all or most of the cannabis they used (Reilly et al., 1998).
Cannabis resin production
Global cannabis resin production estimates are derived from estimates of hashish production in key producing countries, seizure information and intelligence information about the importance of various markets. Another approach has been to estimate cannabis resin production backwards from estimated cannabis herb production, applying the global distribution of cannabis resin to cannabis herb seizures. The two approaches give a range of the likely cannabis resin production from 3 800 to 9 500 tonnes for 2005, and a mid-point estimate of around 6 600 tonnes. Previous year's estimates, based on the same methodology, resulted in a range from 4 200 to 10 700 tonnes with a mid-point estimate of some 7 500 tonnes. These results reflect falling cannabis resin production in the world's largest hashish producing country, Morocco. The declines in Morocco were, however, partially offset by rising levels of cannabis resin production in other parts of the world, notably Afghanistan. As a side-product of the annual village surveys undertaken as part of UNODC's Afghanistan Opium Survey, data on the area of cannabis cultivation are also collected. These surveys found that the area under cannabis (resin) cultivation in Afghanistan rose from some 30 000 hectares in 2004 to 50 000 hectares in 2005-2006 and 70 000 hectares in 2007 (UNODC, 2007, and UNODC, Afghanistan 2007) (Figure 5).
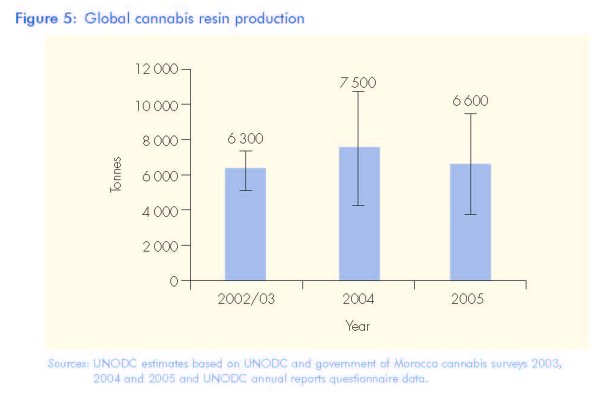
Attempts to break down global cannabis resin production in 2002-2003 suggested that more than 40% of the global cannabis resin supply is being produced in northern Africa and more than a quarter in the Near East and Middle East. These two regions thus accounted for more than two-thirds of global cannabis resin production. Central Asia and South Asia accounted for less than 10% each; South-East Europe for some 5% and the Caribbean for some 3% of global production (UNODC, 2005).
When UN Member States were asked about the source of cannabis resin in their countries, Morocco was also the most often cited country (27% of all mentions over the period 2003-2005 period), followed by Pakistan and Afghanistan. Other important source countries identified are Nepal and India, the Commonwealth of Independent States (CIS) countries, notably Kazakhstan and Kyrgyzstan, the Netherlands and Albania in Europe, Jamaica and Paraguay in Latin America, as well as the Lebanon and Egypt in the Near East. If compared with a similar exercise done previously, data suggest that the importance of Morocco is declining: 31% of all mentions over the 1999-2003 period versus 20% in 2005 (UNODC, 2007) (Figure 6).
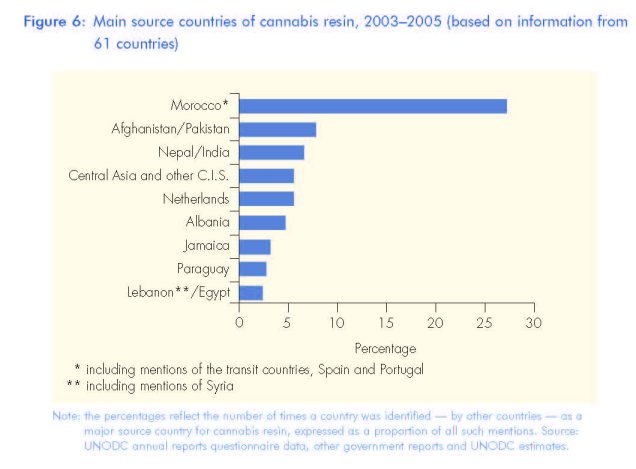
Morocco remains, nonetheless, the world's most significant cannabis resin exporter. In recent years, about 80% of cannabis resin seized in Western Europe originated in Morocco. By 2005-2006, it is estimated that this proportion declined to around 70%. Since resin is the primary form of cannabis consumed in most of Europe, an analysis of cannabis production for the European market must focus on Morocco (see GameIla and Jiménez Rodrigo, this monograph).
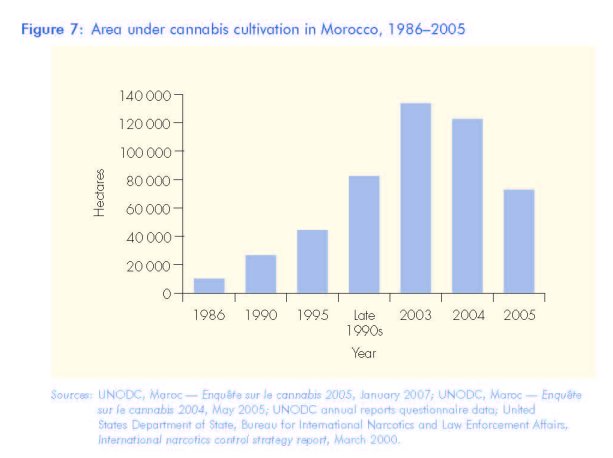
UNODC and the government of Morocco conducted comprehensive cannabis resin surveys of the country in 2003, 2004 and 2005. The resulting estimates are based on the analysis of satellite photos (SPOT 5 and IKONOS) (3) covering the whole of the Rif area of northern Morocco, and subsequent ground truthing. The 2003 survey placed total resin production at about 3 070 tonnes, cultivated on 134 000 hectares of land in the Rif region (equivalent to 10% of the total land or 27% of the agricultural area in the five provinces (4) investigated) by some 96 600 families, providing income for some 800 000 people in the region. This was significantly higher than the previously estimated 80 000-85 000 hectares for the late 1990s by the EU (US Department of State, 2000) or the 44 500 hectares estimated by the Moroccan authorities in 1995 (5).
The 2004 survey showed a 10% decline in the land dedicated to cannabis cultivation (120 500 hectares) compared with a year earlier, with production falling to 2 760 tonnes (UNODC, 2004) (6). This decline was mainly due to lower levels of cannabis cultivation in the provinces of Taounate (-43%) and Al Hoceima (-54%), an indirect consequence of the earthquake in early 2004, which led to increased 'interest' and assistance by the authorities. Most cannabis was produced in the province of Chefchaouen (50% in 2003, 62% in 2004) (Figure 7).
The 2005 survey showed a further strong decline (-40%) in the area dedicated to cannabis cultivation in Morocco to 72 500 hectares. Cannabis resin production declined to 1 066 tonnes. The area under cultivation was, thus, also lower than the levels in the late 1990s. Declines were reported from most provinces, including Chefchaouen (-46%). The largest areas under cannabis cultivation continued to be in the province of Chefchaouen (56% of total), followed by Taounate (17%) and Al Hoceima (16%).
The overall area dedicated to cannabis cultivation in Morocco in 2005 was less than the area found in a previous UNODC cannabis survey in Kazakhstan (330 000 hectares in 1998-1999; though most of this was 'wild cannabis') (UNODCCP, 1999) and less than opium-poppy cultivation in Afghanistan in 2005 (104 000 hectares) but more than opium-poppy cultivation in Myanmar (32 800 hectares) or Laos (1 800 hectares). It was also less than the area under coca cultivation in Colombia (860 000 hectares), but more than the area under coca cultivation in Peru (48 200 hectares) or Bolivia (25 400 hectares) in 2005 (UNODC, 2007).
The yield estimates for 2004 were based on a scientific study, conducted on 30 plots across the five provinces. The yield on rain-fed land was found to amount to 750 kg/ha; the yield on irrigated land was, on average, 1 270 kg/ha in 2004. The rain-fed area amounted to 106 100 hectares; the irrigated area was 14 500 hectares. The overall yield of herbal material amounted, thus, to 813 kg/ha. Total production of cannabis material was estimated at 98 000 tonnes. Out of this cannabis material the farmers produced 1 019 tonnes of first-quality resin, 921 tonnes of second-quality resin and 823 tonnes of third-quality resin, that is, in total some 2 760 tonnes of cannabis resin. This was equivalent to 2.8% of all cannabis material (UNODC Morocco, 2007).
A subsequent yield survey, conducted in 2005, based on data from 87 plots across the cannabis producing provinces, found overall lower results. While average cannabis production on irrigated land increased to 1 821 kg/ha, due to an increasing concentration of cannabis production in more fertile areas of the Rif region, cannabis production on non-irrigated land declined, due to a drought, to just 459 kg/ha. Given the distribution between irrigated and non-irrigated land in the Rif area (14 750 hectares irrigated; 57 728 hectares non-irrigated), the overall average yield amounted to 735 kg/ha, yielding 53 300 tonnes of raw cannabis. The conversion ratio from dried raw material to cannabis resin — based on the analysis from 87 plots — fell to 2 kg of cannabis resin per 100 kg of cannabis raw material in 2005, down from 2.8 kg in 2004. Total cannabis resin production thus amounted to 1 066 tonnes in 2005, down from 2 760 tonnes a year earlier (UNODC Morocco, 2007).
In parallel to the decline in production, cannabis farm gate prices doubled, from 25 Dh/ kg in 2004 to 50 Dh/kg in 2005 (i.e. from EUR 2.3/kg to EUR 4.5/kg); cannabis resin farm gate prices almost tripled, from 1 400 Dh/kg in 2004 to 4 000 Dh/kg in 2005 (i.e. from EUR 127/kg to EUR 363/kg) (UNODC Morocco, 2007). No such price changes were, however, reported from European countries in 2005 (UNODC Morocco, 2007).
The income for the farmers from the production of cannabis resin was around EUR 260 million in 2004, equivalent to 0.7% of GDP. In 2005, high prices led to an increase to EUR 325 million. The amount of money earned with this Moroccan cannabis resin in Western Europe (deducting seizures made in Morocco and in Western Europe) was estimated at around EUR 10.8 billion in 2004. As cannabis resin prices were not reported to have increased significantly in European countries in 20051 the value of the smaller amounts of cannabis exported from Morocco and sold on European markets is estimated to have declined to some EUR 4.6 billion in 2005 (UNODC Morocco, 2007).
The analysis of the THC content, done by the Laboratoire de Recherches et d'Analyses Techniques et Scientifiques, MARATES, based on samples from the 30 plots in 20041 revealed that the dry cannabis leaf had, on average, a THC content of 1.2%; the dried flowering tops had a THC content of on average 2.7% (confidence interval 2.1-3.4%) and the cannabis resin had on average a THC content of 8.3% (confidence interval 7.1-9.4%) with a THC content of the samples analysed from 5.5 to 11.3% (UNODC Morocco, 2005).
Trafficking
Survey data from a number of countries suggest that much of the cannabis consumed is not 'trafficked' in the traditional sense of the word, but rather grown on a small scale and distributed within social networks. As discussed above, cultivation for personal use is widespread in many countries. In the United Kingdom, Atha et al. note that 'most home grown (cannabis) is not sold' and they estimate that 30% of the cannabis used by regular users in the UK was home-grown in 1997 (Atha et al., 1999). If this is correct, a significant share of the cannabis used in the UK at that time was produced and distributed free within the country. A second study concurs, 'domestic production is on the increase and as much as half of the cannabis consumed in England and Wales may be grown here. Some cultivation is on a commercial basis, but much is on a small scale, for personal use or use by friends' (Hough et al., 2003). As this second study suggests, what these small growers do not use or give away, they often sell within their social circle. According to survey data from the United States National Survey on Drug Use and Health, most (78%) of those who say they bought the drug in the last year say they bought it from 'a friend'. Similar figures were found in an international comparative study of cannabis users in Bremen (80%) and San Francisco (95%) (Borchers-Tempel and Kolte, 2002) (7). The 2006 National Survey on Drug Use and Health revealed that 53% of the persons who used cannabis in the last year at least once, obtained it most recently for free (i.e. they shared someone else's cannabis); 42.8% bought it; 1.19% traded something for it; and 0.9% grew it themselves (SAMHSA, 2007). Distribution along social lines thus undercuts many of the negative effects associated with drug markets dominated by organised crime, but it also facilitates access to the cannabis market.
In terms of volume, cannabis remains the most extensively trafficked drug worldwide. Expressed in drug units (doses), 70% of all drug units seized in 2003 concerned cannabis (DELTA, 2005). By 2005, this proportion declined, however, to 59%, followed by cocaine (24%), opiates (12%) and amphetamines (4%) (UNODC, 2007). In contrast to other drugs, most of the cannabis-related trafficking arrests — in most countries — are accounted for by nationals of the respective country (DELTA, 2007).
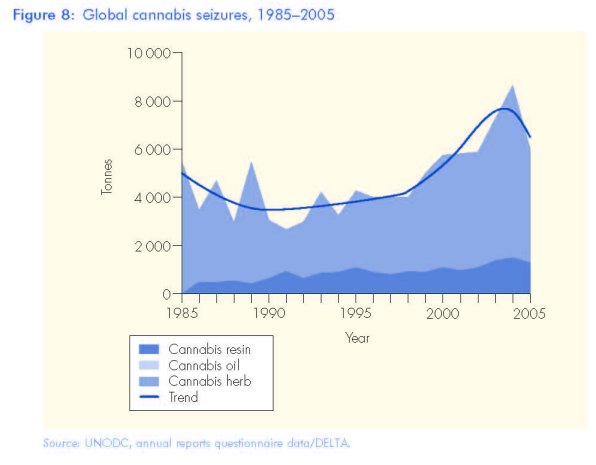
Cannabis end-product seizures showed a small downward trend in the late 1980s, strong increases in the 1990s and in the first years of the new millennium, but declined by 31% in 2005 to around the levels reported in 2002. Cannabis herb seizures amounted to 4 644 tonnes, cannabis resin to 1 302 tonnes and cannabis oil to 0.7 tonnes in 2005. Cannabis herb seizures thus accounted for 78% of all cannabis end-product seizures in 2005. In addition, 32 million cannabis plants and more than 600 tonnes of cannabis plant material were seized worldwide in 2005. This corresponded to a decline of close to 70% compared with 2003 (DELTA, 2007) (Figure 8).
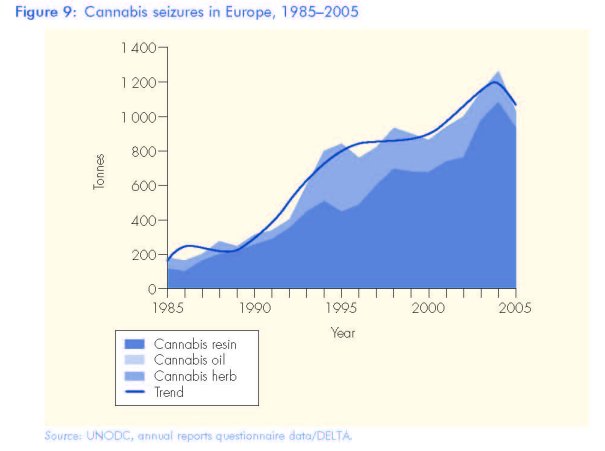
Following years of increase in the 1980s, the 1990s and the first years of the new millennium, cannabis seizures declined by 18% in Europe in 2005. While cannabis herb is the predominant type of cannabis product found globally, cannabis resin is the predominant form of cannabis seized in Europe, accounting for almost 90% of all cannabis end-product seizures in 2005. Most of these seizures have been made by the Spanish authorities (Figure 9).
The global market for cannabis herb in 2003 was estimated at production level to amount to some EUR 8 billion, at the wholesale level to some EUR 28 billion and at the retail level to some EUR 107 billion. The global market for cannabis resin was estimated at the production level to amount to some EUR 0.6 billion, at the wholesale level to some EUR 10 billion and at the retail level to some EUR 27 billion in 2003. In value terms, the cannabis market accounted for 44% of the global drug market (EUR 304 billion)while in terms of the number of drug users (161 million) about 80% of all drug users (200 million) were estimated to consume cannabis (UNODC, 2005). Though no new estimates are available, one could assume that the global cannabis market in 2005 was of similar magnitude.
Trafficking in cannabis herb
More cannabis herb is seized, in a wider range of locations, than any other drug in the world. Out of 182 countries and territories reporting seizures to UNODC over the 2003-2005 period, 165 reported seizures of cannabis herb, more than for heroin (150), cocaine (150), cannabis resin (119), amphetamines (96) or ecstasy (97). Cannabis herb seizures declined, however, by 35% in 2005 to the levels reported in 2000, but were still 92% higher than in 1990 (DELTA, 2007) (Figure 10).
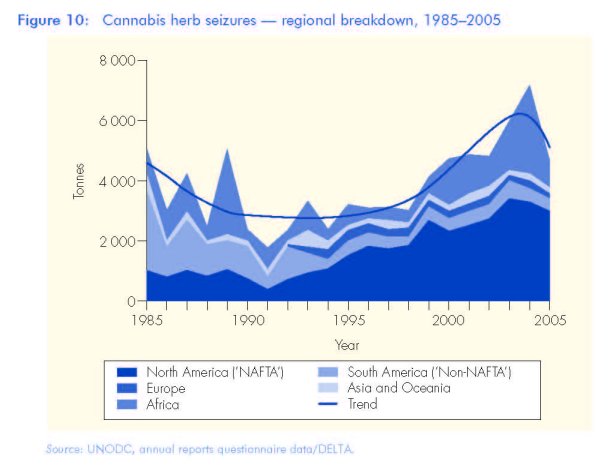
In 2005, 63% of global cannabis herb seizures occurred in North America, followed by Africa (18%) and South America ('non-NAFTA') (11%). The remainder took place in Asia (5%), Europe (2%) and the Oceania region (0.1%). This distribution of seizures, with most cannabis herb seizures being reported from North America followed by Africa and South America, has been consistent for most years since 1994. The proportion of seizures made in North America rose from 32% in 1990 to 63% in 2005 reflecting stronger efforts to fight cannabis trafficking, while the proportion of seizures made in South America declined over the same period from 46% to 11% as cannabis production increasingly shifted to North America, where cannabis with a higher THC content is being produced. The proportion of seizures made in Africa increased from 16% of global cannabis herb seizures in 1990 to a peak of 41% in 2004 (DELTA, 2007), in line with reports of ever larger areas under cannabis cultivation. In 2005, however, the proportion fell back to 18% as eradication efforts were intensified in a number of countries. This decline in cannabis herb production may not be sustainable, however (UNODC, 2007).
The world's largest cannabis herb seizures in 2005 were made by the law enforcement agencies of Mexico (1 781 tonnes or 38% of the total), followed by those of the USA (1 112 tonnes, or 24% of the total). These two countries have led the world in cannabis seizures since 1994 (except for the year 2000, when the USA ranked fifth). The next largest seizures in 2005 were reported by South Africa (6% of total), followed by Brazil, Tanzania, India, Colombia and Nigeria (3% each). The largest seizures among European countries were shown by the Russian Federation (rank 15), followed by the UK (rank 18) (DELTA, 2007).
The share of Europe in global cannabis herb seizures increased from 1% in 1985 to 13% in 1994 as consumption increased, before falling gradually back to 2% of global seizures by 2005. In 2005, cannabis herb seizures declined in Europe by 40% compared with a year earlier, thus exceeding the global decline in that year (-35%). Declines were also reported from Africa, North America and the Oceania region, while seizures increased in Asia and in South America (DELTA, 2007). The decline of cannabis herb seizures in Europe seems to reflect primarily changes in law enforcement priorities in a number of European countries. In addition, the decline may have been due to a decline in cannabis herb imports into Europe, as supply is increasingly shifting towards domestic sources. The fall in seizures does not appear to be due to any significant decline in consumption. Lifetime usage among 15- to 16-year-olds in Europe increased by more than 80% between 1995 and 2003 (UNODC, 2005) and cannabis use also increased among the general population over the last decade. In recent years, cannabis use seems to have reached a plateau in several European countries and started falling in others. However, these declines have been far less important than the reported declines in seizures (UNODC, 2007).
Trafficking in cannabis resin
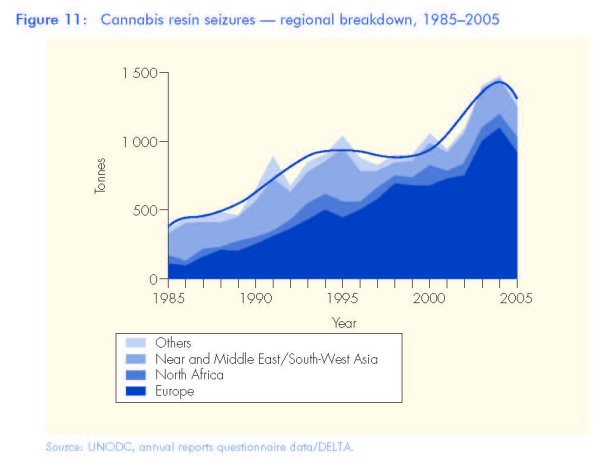
Global cannabis resin seizures declined in 2005 by 11% compared with a year earlier, dropping to 1 302 tonnes, below the levels reported in 2003. Resin seizures declined at a rate above average in Europe (-15%), reflecting falling levels of cannabis resin production in Morocco (DELTA, 2007).
Out of global cannabis resin seizures, Europe accounted for 922 tonnes, of which 916 tonnes (70% of the total) was seized in West and Central Europe, 18% in the Near and Middle East/South-West Asia and 8% in North Africa. The largest seizures worldwide were reported by Spain (670 tonnes, or 51% of the total), followed by Pakistan (94 tonnes, or 7%), Morocco (92 tonnes, or 7%). Significant amounts were also seized by the authorities in Iran (69 tonnes, or 5%) and Afghanistan (42 tonnes, or 3%) (DELTA, 2007). The largest seizures in Europe, after Spain, were reported by France (6% of total in 2005), the UK (5%), Portugal (2%) and Italy (2%) (Figure 11).
The main destination of cannabis resin is West and Central Europe. About 70% of the cannabis resin destined for the West and Central European market in 2005-2006 is estimated to have originated in Morocco, down from around 80% a few years earlier (UNODC, 2007). Much of the cannabis resin transits Spain and the Netherlands before being shipped to other countries (see Gamella and Jiménez Rodrigo, this monograph). Most of the remainder of the resin supply originates in Afghanistan/Pakistan (e.g. 59% in Greece, 30% in Turkey, 30% in the Czech Republic, 14% in Belgium, less than 10% in France and Italy), in Central Asia (mostly for the Russian Federation, other CIS states and some of the Baltic countries) or from within Europe (mainly Albania, supplying the markets of various Balkan countries and Greece) (DELTA, 2007).
The second-largest destination of cannabis resin is the Near and Middle East/South-West Asia region. This region is mainly supplied from cannabis resin produced in Afghanistan and Pakistan and, to a lesser degree, from cannabis resin originating in Lebanon. Some of the cannabis resin from Afghanistan/Pakistan is also being shipped to Canada and to countries in Eastern Africa.
North Africa makes up the third-largest market and is predominantly supplied by cannabis resin produced in Morocco. The importance of other markets is limited. Nepal is a source country for cannabis resin exports to India and to some other countries and Jamaica is a source country for cannabis resin exports to some other countries in the Americas.
More research required
Generating sound estimates of global cannabis production levels is likely to remain a slippery subject for many years to come, but there are several areas where data could be improved greatly:
• There is a need for more scientific surveys on the areas under cannabis cultivation. These should help to identify the areas under 'wild cannabis' and the areas where cannabis is cultivated, on irrigated and on rain-fed land. This may be expensive, but remote sensing technology is becoming more readily available and is being used in other areas of agriculture. Using a sampling approach, a growing number of countries should be in a position to undertake such surveys if control of cannabis cultivation is deemed a priority. Where satellite imagery is not available, UNODC has developed methods to identify illicit crops by means of a sampling approach and helicopter over-flights, as well as through ground surveys. The 'know-how' for such surveys is readily available in UNODC to be shared with Member States. The situation is more difficult when it comes to indoor cultivation which, in general, cannot be identified through the analysis of satellite photos or helicopter overflights. Nonetheless, more reliable estimates on the extent of outdoor cultivation of cannabis could form the basis for reasonably good estimates on the likely extent of such indoor cultivation activities, in combination with eradication data and forensic analyses of cannabis seizures.
• There is also a need for scientific yield data across a wide typology of cultivars and cultivation styles. Feral or semi-cultivated strains found in Kazakhstan are likely to differ greatly in productivity when compared with intensively grown cannabis in Morocco, or informal plots in South Africa, or indoor operations in Canada. These figures will remain imprecise, but at the very least, a plausible range of values needs to be compiled.
• Distinction between the various cannabis products is essential: a standardised definition of sinsemilla would be useful to differentiate this drug from other herbal can
• The quality of reported seizure data should be analysed. One possible source of the discontinuity between supply- and demand-based production estimates could be inflated seizure data, based on either inaccurate plant-to-product conversion rates or the inclusion of bulk plant material not suitable for sale. Finally, there is a general danger of double counting once various law enforcement bodies are involved.
• There remains a need to analyse, on a systematic basis, the THC content of cannabis found on the market, and its development over time. Standards to undertake such analyses in an internationally comparable way would need to be developed. Forensic analysis could also help to identify the sources of the cannabis.
• It would also be useful to have studies made of the distinction between the drug as sold and the drug as used. Herbal cannabis users, including sinsemilla users, clean their product before consumption. This could help to explain some of the significant differences between supply and demand-side estimates.
On the demand side, more data are required on cannabis consumption (amounts consumed per cannabis user). While some data exist on the number of days of use amongst annual users, the data on volumes consumed remain dubious. Scientific study needs to be made of the standard dose for inexperienced users and the rate and extent to which tolerance develops. In addition to this, empirical observation of actual use patterns needs to be made across a wide range of cultural contexts. User surveys would benefit if they were to distinguish between herbal cannabis and cannabis resin consumption.
(1) The proportions were calculated based on 59369 cannabis herb samples, 1 225 cannabis resin samples and 443 cannabis oil samples analysed by forensic laboratories in the USA over the 1975-2006 period. Two-thirds of the 2006 samples were obtained from law enforcement seizures and purchases, and the remaining were from domestic eradications. The law enforcement seizures were obtained from 45 different states across the USA (University of Mississippi, 2007).
(2) The terminology in this area can be confusing. While it is possible to produce seeded cannabis indoors, most indoor operations of any scale produce sinsemilla, and as do nearly all hydroponic operations. And while there is extensive outdoors production inside consumer countries like the USA, in many developed countries there is a substantial overlap between domestically produced cannabis and indoor-produced cannabis, due to poor climate and the presence of law enforcement, as well as a desire to enhance yield and potency through available technology. The term 'skunk' is also used for high potency strains of cannabis in parts of Europe and Oceania, a reference to an early 'Indica/ Sativa' cultivar that forms the basis of many modern breeds.
(3) The survey was based on the analysis of 16 SPOT5 (multi-spectral, 10m resolution) and 13 IKONOS (panchromatic, 1 m resolution).
(4) The five provinces were Al Hoceima, Chefchaouen, Larache, Taunate and Tétouan.
(5) It should be noted, though, that all cultivation estimates prior to 2003 have not fulfilled strict scientific criteria and must thus be treated with caution.
(6) Some of the decline appears to have been a consequence of an earthquake, resulting in increased attention being given by the national authorities and the international community to the region concerned.
(7) This study also included users in Amsterdam, most of whom bought their cannabis from a coffee shop.
Bibliography
Abel, S. (1997), 'Cannabis policy in Australia and New Zealand', Drug and Alcohol Review 16(4): 421-428.
Alpers, P. (2005), 'Gun-running in Papua New Guinea: from arrows to assault weapons in the
Southern Highlands', Small Arms Survey Special Report No. 5, Small Arms Survey, Geneva, 62. Atha, M. (2002), Cannabis use in Britain, Independent Drug Monitoring Unit Publications, Wigan. Atha, M., Blanchard, S., Davis, S. (1999), Regular users ll: UK drugs market analysis, purchasing patterns, and prices, 1997, Independent Drug Monitoring Unit Publications, Wigan.
Australian Crime Commission (2004), Illicit Drug Data Report 200314, government printers, Canberra, 34.
Australian Crime Commission (2007), Illicit Drug Data Report 200516, government printers, Canberra.
Borchers-Tempel, S., KoIte, B. (2002), 'Cannabis consumption in Amsterdam, Bremen, and San Francisco: a three-city comparison of long-term cannabis consumption', Journal of Drug Issues 32(2): 395-412.
Bundeskriminalamt (2005), Bundeslagebild Rauschgift 2004: Bundesrepublik Deutschland, May, 44. Bureau for International Narcotics and Law Enforcement Affairs (2005), International Narcotics Control Strategy Report, Department of State, Washington.
Clarke, R. (1981), Marijuana Botany, Ronin, Berkeley.
Clarke, R. (1998), Hashish!, Red Eye Press, Los Angeles.
DELTA (2005), United Nations Office on Drugs and Crime DELTA database.
DELTA (2007), United Nations Office on Drugs and Crime DELTA database.
Drug Availability Steering Committee (2002), Drug availability estimates in the United States, government printers, Washington.
Drug Enforcement Administration of the United States (DEA) (2003), Country profile: Mexico, DEA Drug Intelligence Briefs, Department of Justice, Washington.
Drug Enforcement Administration of the United States (DEA) (2005), Annual crop eradication figures, Department of Justice, Washington.
GameIla, J., Jiménez Rodrigo, M. (2004), 'A brief history of cannabis policies in Spain (1968-2003)', Journal of Drug Issues 34(3): 623-660.
Haney, A., Bazzaz, F. (1970), 'Some ecological implications of the distribution of hemp (Cannabis sativa L.) in the United States of America', in Joyce, C., Curry, S. (eds), The botany and chemistry of cannabis, Churchill, London, 39.
Hough, M., Warburton, H., Few, B., May, T., Man, L., Witton, J., Turnbull, P. (2003) A growing market: the domestic cultivation of cannabis, Joseph Rowntree Foundation, York.
INCB (2005), Report of the International Narcotics Control Board for 2005, International Narcotics Control Board, Vienna.
King, L., Carpentier, C., Griffiths, P. (2004), An overview of cannabis potency in Europe, Insights
Series No. 6, European Monitoring Centre for Drugs and Drug Addiction, Lisbon.
King, R., Mauer, M. (2005), The war on marijuana: the transformation of the war on drugs in the
1990s, The Sentencing Project, Washington.
National Drug Intelligence Center (2005), National drug threat assessment 2005, United States Department of Justice, Washington.
National Drug Intelligence Center (2006), National drug threat assessment 2006, United States Department of Justice, Washington.
National Drug Intelligence Center (2007), National drug threat assessment 2007, United States Department of Justice, Washington.
Niesink, R., Rigter, S., Hoek, J. (2005), THC-concentraties in wiet, nederwiet en hasj in Nederlandse coffeeshops (2004-2005), Trim bos Institute, Utrecht.
Observatoire Géopolitique des Drogues (2000), Annual report 199811999, 61.
Office of National Drug Control Policy (ONDCP) (2000), What America's users spend on illegal drugs, 1988-1998, Office of the Presidency, Washington, 22.
Plecas, D., Dandurand, Y., Chin, V., Segger, T. (2002), Marihuana growing operations in British Columbia: an empirical survey, International Centre for Criminal Law Reform and Criminal Justice Policy, Vancouver.
President's Commission on Organized Crime (1986), America's habit: drug abuse, drug trafficking, and organized crime, Washington.
Reilly, D., Didcoff, P., Swift, W., Hall, W. (1998), long-term cannabis use: characteristics of users in an Australian rural area', Addiction 93: 837-846.
Royal Canadian Mounted Police (RCMP) (2002), Marihuana cultivation in Canada: evolution and current trends, Criminal Intelligence Directorate, Ottawa.
Royal Canadian Mounted Police (RCMP) (2004), The drug situation in Canada, Criminal Intelligence Directorate, Ottawa.
SAMHSA (2007), National survey on drug use and health 2006, Substance Abuse and Mental Health Services Administration, Rockville.
Second Technical Conference on Drug Control Research (2004), Vienna, 19-21 July.
Stamler, R., Fahlman, R., Vigeant, H. (1985), 'Illicit traffic and abuse of cannabis in Canada', Bulletin on Narcotics 37(4): 37-49.
United Nations Drug Control Programme (UNDCP) (1997-1998), 'Cannabis as an illicit narcotics crop: a review of the global situation of cannabis consumption, trafficking and production', Bulletin on Narcotics 49 (1 and 2) (1997) and 50 (1 and 2) (1998), Double issue on cannabis: recent developments, 45-83.
UNODCCP (1999), 'The value of drug seizure data as an analytical tool', in Global Illicit Drug Trends 1999, United Nations Office for Drugs Control and Crime Prevention, Vienna, 16-17.
UNODC (Morocco, 2005), Maroc Enquête sur le cannabis 2004.
UNODC (Morocco, 2007), Maroc Enquête sur le cannabis 2005.
UNODC (Afghanistan, 2007), Afghanistan opium survey 2007, executive summary, August. UNODC (2004), World drug report 2004, United Nations Office on Drugs and Crime, Vienna. UNODC (2005), World drug report 2005, United Nations Office on Drugs and Crime, Vienna. UNODC (2006), World drug report 2006, United Nations Office on Drugs and Crime, Vienna. UNODC (2007), World drug report 2007, United Nations Office on Drugs and Crime, Vienna. UNODC (ARQ), Annual Reports Questionnaire data.
United States Department of Justice (2007), Domestic cannabis cultivation assessment 2007, National Drug Intelligence Center.
US Department of State (2000), 1999 International Narcotics Control Strategy Report, Bureau for International Narcotics and Law Enforcement Affairs, Washington.
United States Drug Enforcement Agency (2003), Mexico: country profile for 2003, Department of Justice, Washington, 12-13.
University of Mississippi (2007), Cannabis potency monitoring project report 95, January.
Wilkins, C., Casswell, S., Bhatta, K., Pledger, M. (2002), Drug use in New Zealand: national surveys
comparison 1998 and 2001, Alcohol and Public Health Research Unit, University of Auckland, 31.
Williamson, C. (2005), Personal communication, 7 September, Office of National Drug Control Policy, Washington.
| < Prev | Next > |
|---|


