Appendix to report 4: country reports UNITED STATES
| Reports - A Report on Global Illicit Drugs Markets 1998-2007 |
Drug Abuse
UNITED STATES
1 General information
Location:
North America, bordering both the North Atlantic Ocean and the North Pacific Ocean, between Canada and Mexico
Area:
9,826,630 sq km
Land boundaries/coastline:
12,034 km / 19,924 km
Border countries:
Canada 8,893 km (including 2,477 km with Alaska), Mexico 3,141 km
note: US Naval Base at Guantanamo Bay, Cuba is leased by the US and is part of Cuba; the base boundary is 28 km
Population:
303,824,640 (July 2008 est.)
Age structure:
0-14 years: 20.1% (male 31,257,108/female 29,889,645)
15-64 years: 67.1% (male 101,825,901/female 102,161,823)
65 years and over: 12.7% (male 16,263,255/female 22,426,914) (2008 est.)
Administrative divisions:
50 states and 1 district
GDP (purchasing power parity):
$13.78 trillion (2007 est.)
GDP (official exchange rate):
$13.84 trillion (2007 est.)
GDP- per capita (PPP):
$45,800 (2007 est.) (CIA The World Factbook)
Drug research
There is a great deal of drug related research in the United States. The National Institute on Drug Abuse (NIDA) claims to account for 85% of all global research funding on drug abuse. Its $1 billion budget is dominated by research on the biology of drugs but it also has large grant programs on epidemiology, prevention and treatment. In recent years, the Clinical Trials Network has emerged as a major new initiative. Additional research funds are supplied by other federal agencies such as the Substance Abuse and Mental Health Services Administration and the National Institute of Justice; private foundations provide smaller amounts. The research is conducted both by academics and by specialized research organizations. Funding for research on drug enforcement is little.
Main drug-related problems
The drug-related problems of the United States cover production, trafficking (mainly import) and consumption. There is substantial production of cannabis and ATS for the domestic market. Trafficking includes import of cannabis (mainly from Mexico), ATS (methamphetamine from Mexico and Canada), opiates (mainly from Latin America) and cocaine (mainly from Colombia through Mexico). The United States also face consumption of all four groups of substances.
2 Drug problems
2.1 Drug supply
2.1.1 Production
There are no meaningful estimates of domestic production of either cannabis or ATS available for the US.
The ongoing increase in THC levels is changing the cannabis market. In Canada and the USA, where large scale eradication efforts have been successful, the growth of THC levels likely reflects the ongoing shift towards indoor production of high potency cannabis. The average THC levels of cannabis on the US market almost doubled between 1999 and 2006, from 4.6% to 8.8% (UNODC, 2008).
Marijuana remains one of the most profitable products for drug trafficking organizations. While the bulk of the marijuana consumed in the United States is produced in Mexico, Mexican criminal organizations have recognized the increased profit potential of moving their production operations to the United States, reducing the expense of transportation and the threat of seizure during risky border crossings. Additionally, Mexican traffickers operating within the United States generally attempt to cultivate higher quality marijuana than they do in Mexico. This domestically produced sinsemilla higher-potency marijuana) can fetch 5 to 10 times the wholesale price of conventional Mexican marijuana.
Outdoor marijuana cultivation in the United States is generally concentrated in the remote national parks and forests of seven States (California, Kentucky, Hawaii, Washington, Oregon, Tennessee, and West Virginia). Close to 4.7 million of the over
6.8 million marijuana plants eradicated in the United States in 2007 were eradicated outdoors in California, including
2.6 million plants eradicated from California’s Federal lands (The White House, 2008).
2.1.2 Trafficking
Additional information
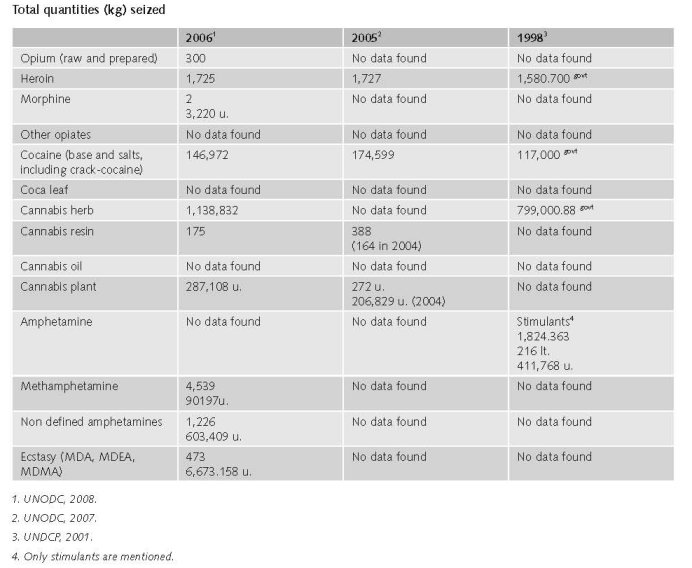
In 2006, in the USA 0.1% of the world total of opium was seized (300 kg).
In 2006, in the USA 2% of the world total of heroin was seized (1,727 kg)
(UNODC, 2008)

(UNODC, 2008a)
Estimated retail value
There are no post-2000 estimates of quantities or expenditures (expert’s comments).
1997
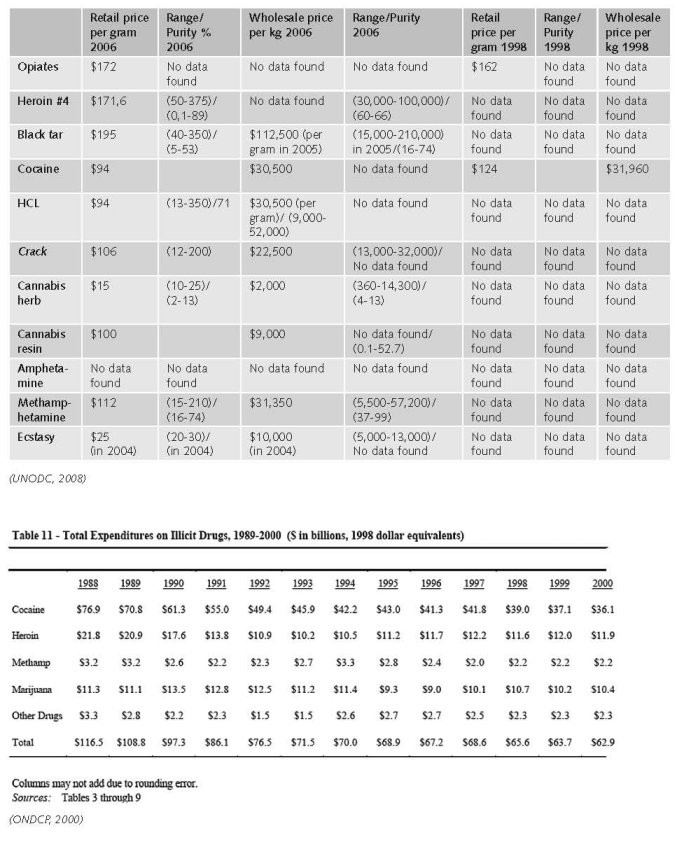
Using a consumption-based approach, we investigated the dollar expenditures by Americans on illicit drugs.
We estimated that:
In 1998, Americans spent $66 billion on the following drugs
• $39 billion on cocaine
• $12 billion on heroin
• $2.2 billion on methamphetamine
• $11 billion on marijuana
• $2.3 billion on other illegal drugs
Between 1988 and 1998, expenditures on cocaine appear to have fallen. This trend results partly from a decrease in the number of users, but mostly from a decrease in cocaine street price. Heroin expenditures fell from 1988 to the middle of the 1990s. Heroin expenditures appear to have increased since then.
Trends in methamphetamine purchases are imprecise because of significant measurement problems. While expenditures may have fallen due to changes in the consumer price index, consumption levels have remained about the same over the last decade.
Between 1989 and 1998, expenditure on marijuana increased slightly (as marijuana prices increased) then decreased slightly (as marijuana prices fell).
Between 1989 and 1998, expenditures on other illicit drugs, and on legal drugs used illicitly, remained fairly constant (ONDCP, 2000).
Additional information
Price of one pure gram of powder cocaine 1998 average (< 2 grams): $132.09 (trend from 1981 price is dropping).
Price of one pure gram of crack cocaine 1998 average (1-15 grams): $77.34 (trend from 1981 price is dropping).
Price of one pure gram of heroin 1998 average (1-10 grams): $294.42 (trend from 1981 price is dropping).
Price of one pure gram of methamphetamine 1998 average (<10 grams): $256.02 (trend from 1981 price is dropping).
Price of one pure gram of marijuana 1998 average (<10grams): $8.67 (trend from 1981 price in 1981 was lower than in 1998, increased between 1983-1995 and is in 1998 at lowest point) (ONDCP 2004).
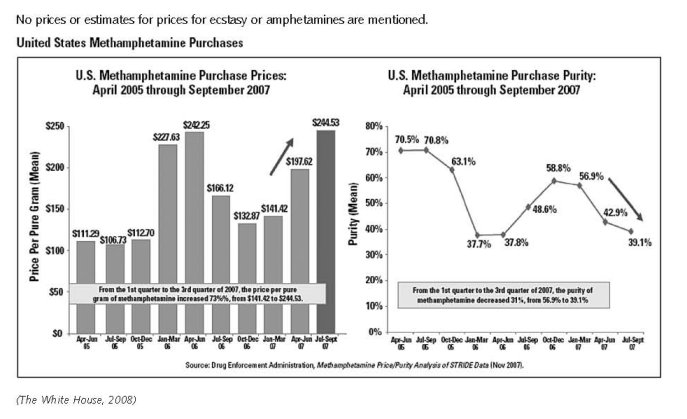
No prices or estimates for prices for ecstasy or amphetamines are mentioned.
Opiates
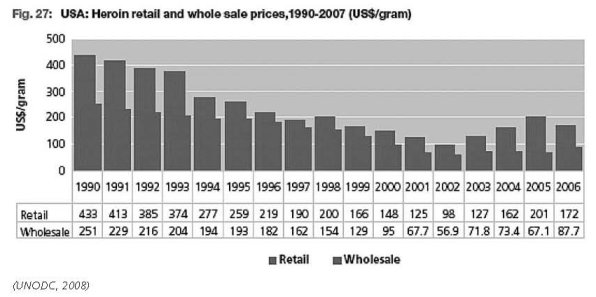
Retail price per gram 2006: $172
Retail price per gram 1998: $162
Wholesale price per kilogram: 2006 $87,720
Wholesale price per kilogram1998: $125,000
Heroin
Retail price per gram 2006: $171.6; range (50-375); purity % (0.1-89)
Wholesale price per kilogram 2006: $87,720 range (30,000-100,000); purity % (60-66)
Black tar
Retail price per gram 2006: $195; range (40-350); purity % (5-53)
Wholesale price per kilogram 2005: $112,500; range (15,000-210,000); purity % ( 16-74)
HCL
Retail price per gram 2006: $94 range (13-350); purity % ( 71) (2007) $122
Retail price per gram 1998: $124
Wholesale price per kilogram 2006: $30,500; range (9,000-52,000)
Wholesale price per kilogram 1998: $31,960
Crack
Retail price per gram 2006: $106; range (12-200)
Wholesale price per kilogram 2006: $22,500; range (13,000-32,000)
Cannabis herb
Retail price per gram 2006:$15; range (10-25); purity % (2-13)
Wholesale price per kilogram 2006:$2,000; range (360-14,300); purity % (4-13)
Cannabis resin
Retail price per gram 2006:$100
Wholesale price per kilogram 2006: $9,000; purity % (0.1-52.7)
Amphetamine
No data found on USA in World Drug Report 2008
Methamphetamine
Retail price per gram 2006: $112; range (15-210); purity %( 16-74)
Wholesale price per kilogram 2006: $31,350; range (5,500-57,200); purity (37-99)
Ecstasy
Retail price per gram 2004: 25; range (20-30)
Wholesale price per kilogram 2004:10,000; range (5,000-13,000)
(UNODC, 2008)
2.2 Drug Demand
2.2.1 Experimental/recreational drug users in the general population
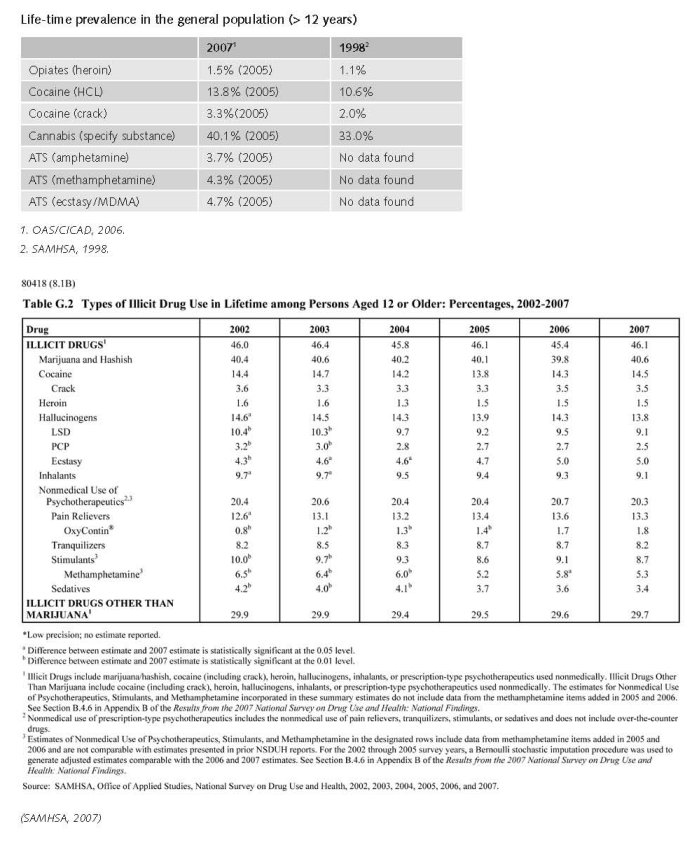
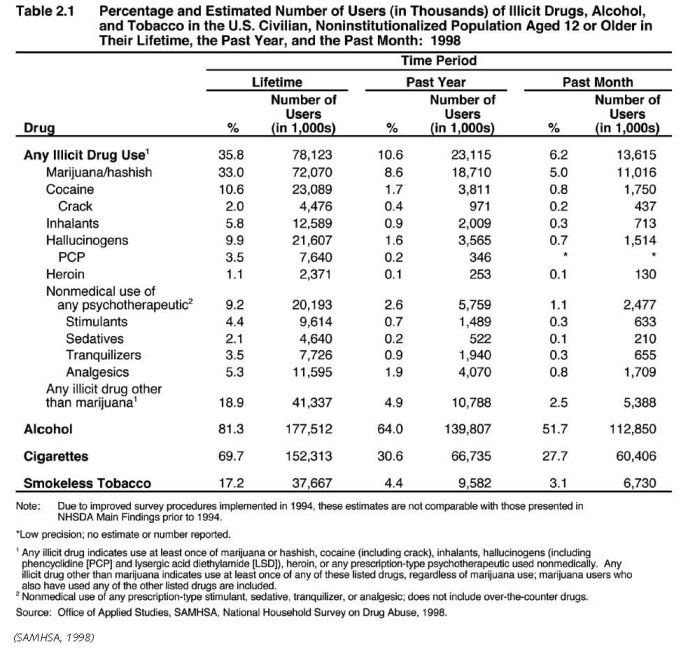

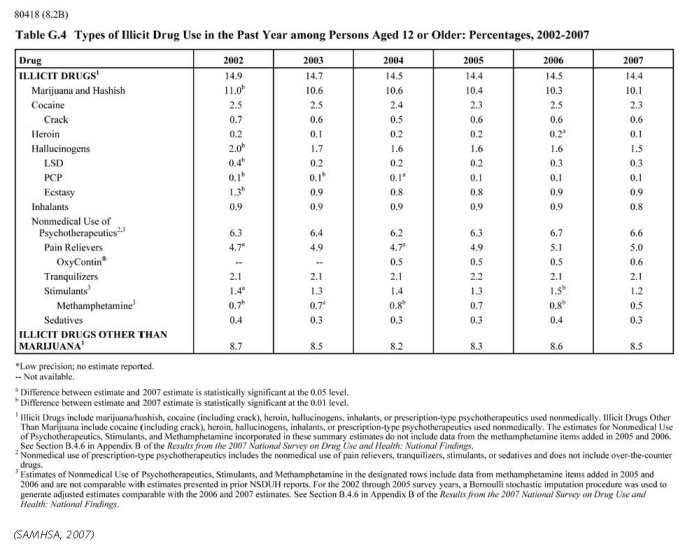
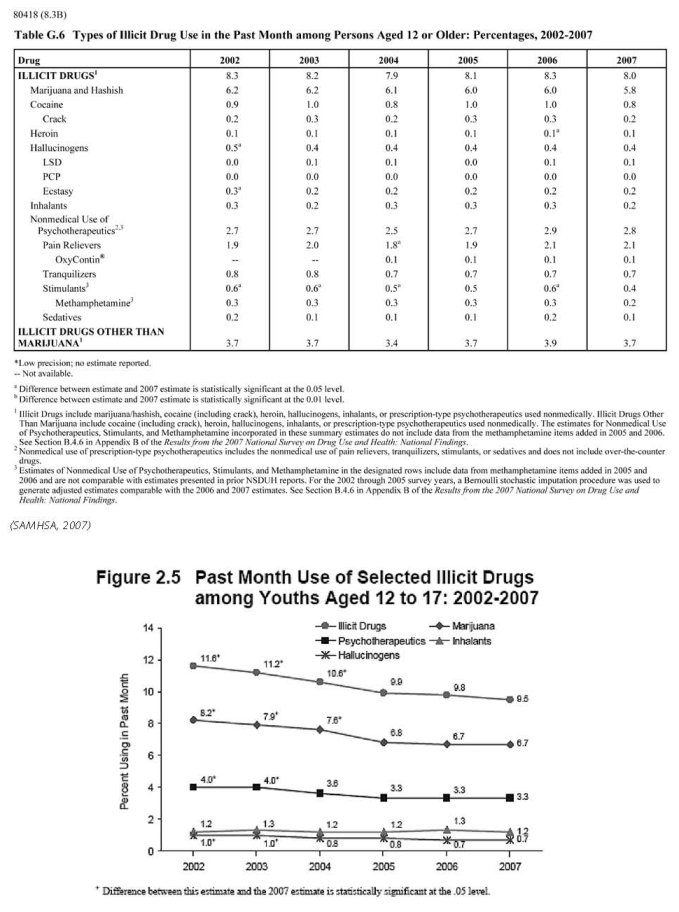
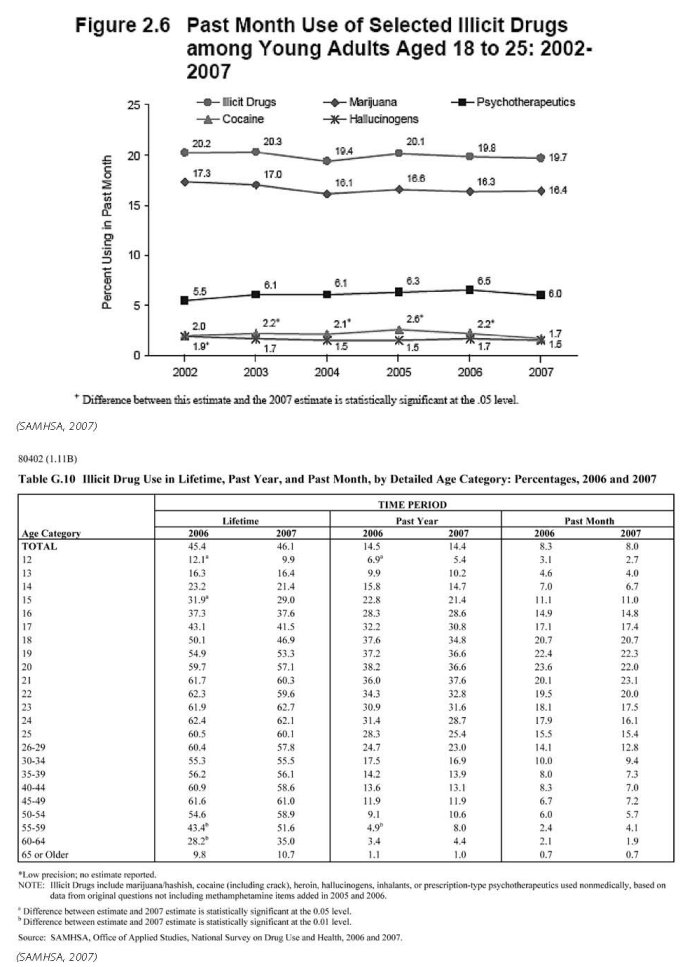
One of the more disturbing data trends identified in the past several years is a dramatic rise in current drug use among adults aged 50-54. This trend does not necessarily mean that people are taking up drug use as they enter middle age, but rather that a segment of the population that experienced high rates of drug use in their youth continue to carry high rates of use with them as they get older (The White House, 2008).
However, data has also alerted us to a rising and troubling threat: the abuse of prescription drugs. The only major category of illegal drug use to have risen since 2002, prescription drug abuse poses a particular challenge, as these substances are widely available to treat legitimate medical conditions and can often be obtained within the home. These medications are both a blessing to those with chronic illness and a challenge for those who are at risk for substance abuse. Opioid pain-killers are the most widely abused drugs in this category. The 2006 National Survey on Drug Use and Health shows that 71 percent of those abusing prescription pain relievers in the past year obtained them from friends or family; the vast majority received them for free (The White House, 2008).
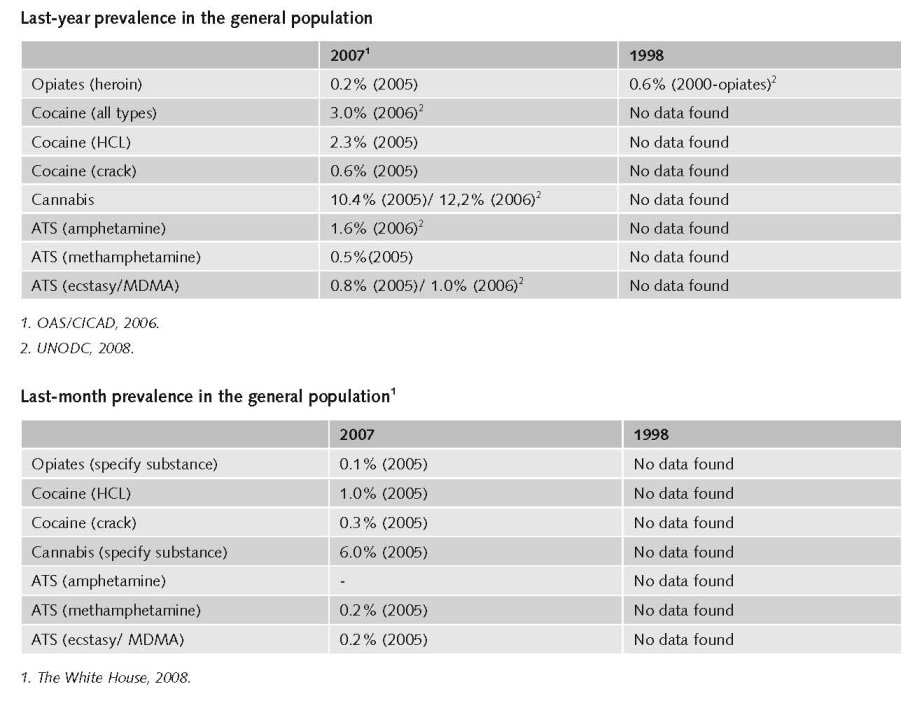
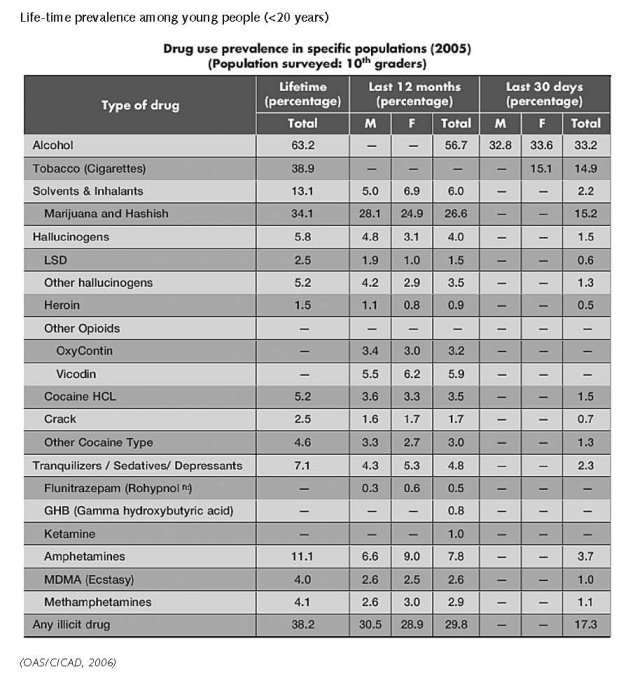
The annual prevalence of heroin consumption among 8th-12th grade students in the USA fell from 1.3% in 2000 to 0.8% in 2005 and remained at that level in both 2006 and 2007.
Since 2001, youth use of marijuana has declined by 25 percent, while youth use of any illicit drug has declined by
24 percent— remarkably similar trends (The White House, 2008).
2.2.2 Problematic drug users/chronic and frequent drug users
There is no information on the number of problematic/chronic-frequent users (in the general population).

In the United States the number of injecting drug users is estimated to be 1,364,000 (IHRA, 2008).
Mathers et al. report a 2002 estimate of prevalence of people who inject drugs in the USA of 0.67%( low), 0.96%( mid), 1.34%( high). The number of people who inject drugs is estimated 294,929 (low) 1,857,354 (mid), 2,589,858 (high) (Mathers et al., 2008).
2.3 Drug related Harm
2.3.1 HIV infections and mortality (drug related deaths)
The number of HIV infected injecting drug users
Mathers et al. report a 2003 HIV prevalence among people who inject drugs of 8.74 (low), 15.57 (mid) to 22.4 (high) (Mathers et al., 2008).
The number of newly HIV infected injecting drug users
Transmission by multiple use of contaminated injecting equipment accounts for 18% of new HIV diagnoses in the United States (2005). (UNAIDS, 2008)
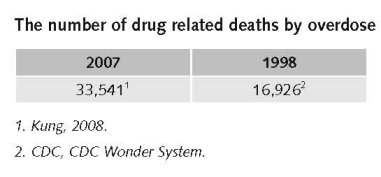
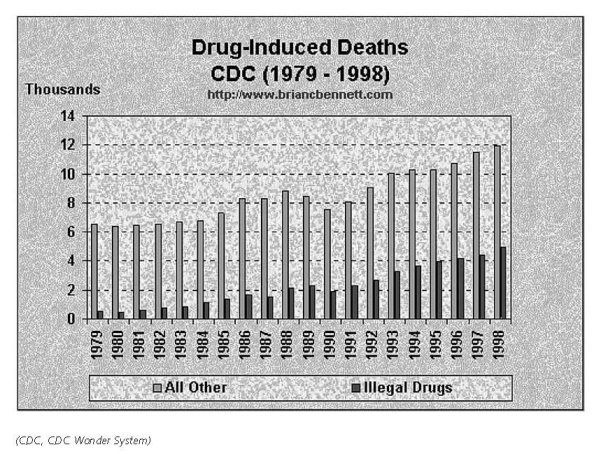
In 2005, a total of 33,541 persons died of drug-induced causes in the United States. The category ‘‘drug-induced causes’’ includes not only deaths from dependent and nondependent use of either legal or illegal drugs, but also includes poisoning from medically prescribed and other drugs.
2.3.2 Drug related crime or (societal) harm
There are substantial costs associated with methamphetamine production, particularly from environmental hazards.
Drug market violence was substantial in 1998 and is now much less but it is impossible to document that. Many outdoor markets have moved indoors, which has reduced crime and disorder (expert’s comments).
3 Drug policy
3.1 General information
3.1.1 Policy expenditures
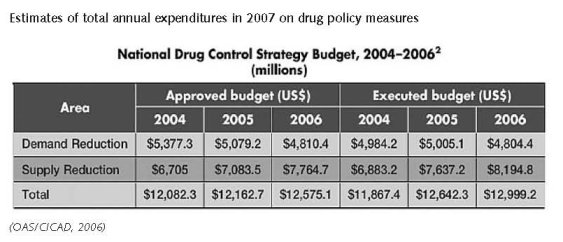
Through the President’s Access to Recovery Program, approximately $400 million in Federal funds have delivered a comprehensive spectrum of services tailored to the individual, including recovery support services (The White House, 2008).
Expert comments
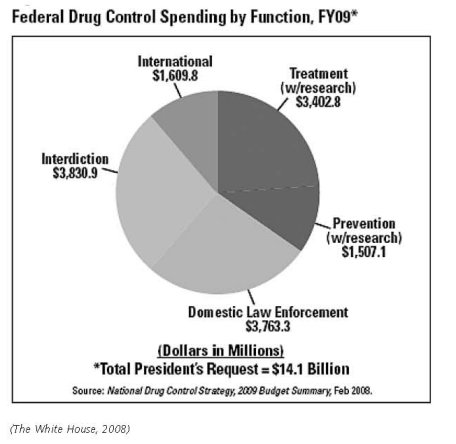
These only include federal expenditures and exclude some major items, in particular the costs of prosecution and imprisonment. It is usually assumed that state and local governments spend as much as the federal government. Total national expenditures, dominated by enforcement, are probably around $35 billion.
Additional information
The executive budget the for National Drug control Strategy grew from $12.1 billion in 2004 to $12.5 billion in 2005, primarily due to increased resources for supply reduction. Spending on demand reduction showed little change from 2004 to 2005, and a decreased budget for 2006 was reported for this component of the strategy (OAS/CICAD, 2006).
Expert comments
The problem in making comparisons with 1998 is that the federal government changed the method for calculating expenditures in 2002. As a result it is impossible to make comparisons between 1998 and 2007 but it is safe to say that both federal and total government expenditures did increase over that time period.
3.1.2 Other general indicators
Numbers available on arrests and imprisonment for drug-law related offences
Numbers available on arrests and imprisonment for use/possession for personal use
Sourcebook of Criminal Justice Statistics 2003, page 392
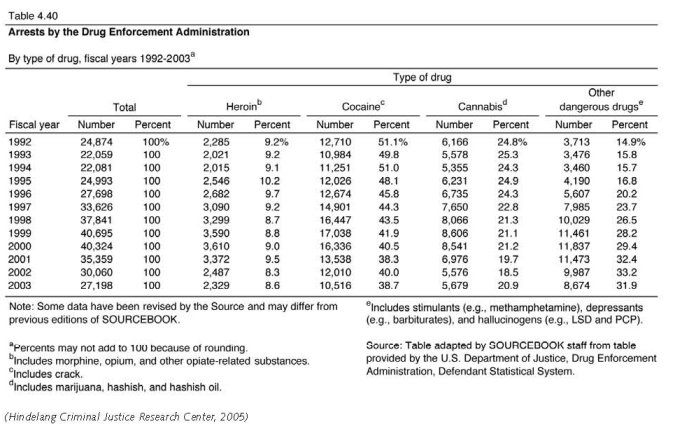
Arrests have been flat, except for marijuana possession arrests, which have increased. Total incarceration for drug offenses has increased sharply (expert’s comments).
Additional information
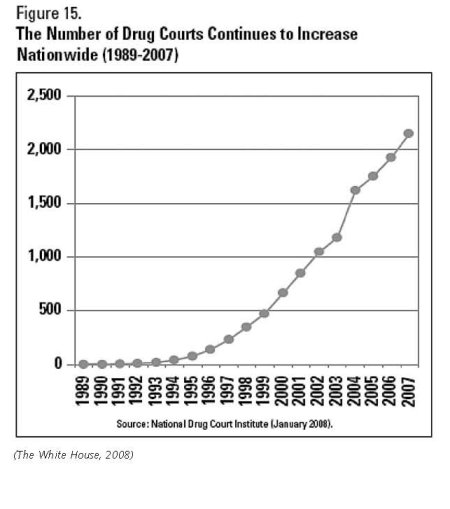
In the criminal justice system, Drug Courts are putting nonviolent offenders with drug problems in treatment programs instead of jails (The White House, 2008). The total numbers for drug courts are very small, barely 1% of all those processed by the criminal justice system.
In 2007, there were an estimated 1.6 million adults aged 18 or older on parole or other supervised release from prison during the past year. Almost one fourth of these (24.1 percent) were current illicit drug users, higher than the 7.7 percent among adults not on parole or supervised release (SAMHSA, 2007).
In 2007, adults aged 18 or older who were on parole or a supervised release from jail during the past year had higher rates of dependence on or abuse of a substance (37.2 percent) than their counterparts who were not on parole or supervised release during the past year (8.9 percent) (SAMHSA, 2007).
In 1996, California became the first State to allow the use of marijuana for medical purposes. California’s Proposition 215, also known as the Compassionate Use Act of 1996, was intended to ensure that “seriously ill” residents of the State had access to marijuana for medical purposes, and to encourage Federal and State governments to take steps toward ensuring the safe and affordable distribution of the drug to patients in need (The White House, 2008).
However this feature has been under fire ever since it started and also in the National Drug Control Strategy there is a substantial criticism toward the medical prescription of marijuana.
Medical use of cannabis
Under state law, 12 states currently provide legal protection for seriously ill patients whose doctors recommend the medical use of marijuana: Alaska, California, Colorado, Hawaii, Maine, Montana, Nevada, New Mexico, Oregon, Rhode Island, Washington, and Vermont. Federal law does not prevent states from removing state criminal penalties for the medical use of marijuana. Nothing in the U.S. Constitution or federal law prohibits states from enacting penalties that differ from federal law (Marijuana Policy Project).
3.2 Supply reduction: Production, trafficking and retail
The main focus is on trafficking and retail.
Priorities of drug policy on drug production, supply and trafficking covered by policy papers and/or law
Drugs legislation in the United States aims at reducing the number of drug users in the country. The principal legislation addressing drug abuse is the Controlled Substances Act (1970).This federal law divides narcotics into five schedules based on a drug’s potential for abuse, likelihood for dependence and accepted medical use. Schedule I contains those drugs with the highest potential for abuse and lowest medical use, and Schedule V contains those with high medical use and low potential for abuse. However, different States have their own legislation for scheduling drugs and for punishment, which allows each State to interpret the federal law as applied in state sentencing. This enables States to decide upon harshness of sentencing for those individuals that appear in State courts (the majority of drug cases).
Punishments vary according to the amount of a drug a person is caught with for serious (Schedule I and II) drugs. People caught with smaller amounts (for personal use or close friend supply) are punished less harshly than those who have larger amounts for dealing.
National Drug Control Strategy: With tools that have proven effective, we will rise to these challenges and seek to achieve a further 10 percent reduction in youth drug use in 2008, using 2006 as the baseline. This effort will continue to be guided by the three National Priorities set by the President in 2002:
• Stopping Drug Use Before It Starts;
• Intervening and Healing America’s Drug Users;
• Disrupting the Market for Illegal Drugs.
(The White House, 2008)
Most important statements
The National Drug Control Strategy will complement and support the National Security Strategy of the United States by focusing on several key priorities:
• Focus U.S. action in areas where the illicit drug trade has converged or may converge with other transnational threats with severe implications for U.S. national security;
• Deny drug traffickers, narco-terrorists, and their criminal associates their illicit profits and access to the U.S. and international banking systems;
• Strengthen U.S. capabilities to identify and target the links between drug trafficking and other national security threats and to anticipate future drug-related national security threats;
• Disrupt the flow of drugs to the United States and through other strategic areas by building new and stronger bilateral and multilateral partnerships.
(The White House, 2008).
3.3 Demand reduction: Experimental/recreational drug use + problematic use/chronic-frequent use
Additional information
Drug Abuse prevention programmes in the US, targeting key populations and are in general compatible with the CICAD Hemispheric Guidelines on School-based Prevention (OAS/CICAD, 2006). But there is insufficient information to assess the extent of coverage of the target population.
There are many mass media campaigns targeting especially young people in the USA. Also there are substance specific campaigns addressing the dangers of methamphetamine use, ecstasy use, cannabis etc. There is a National Youth Anti-Drug Campaign (The White House, 2008).

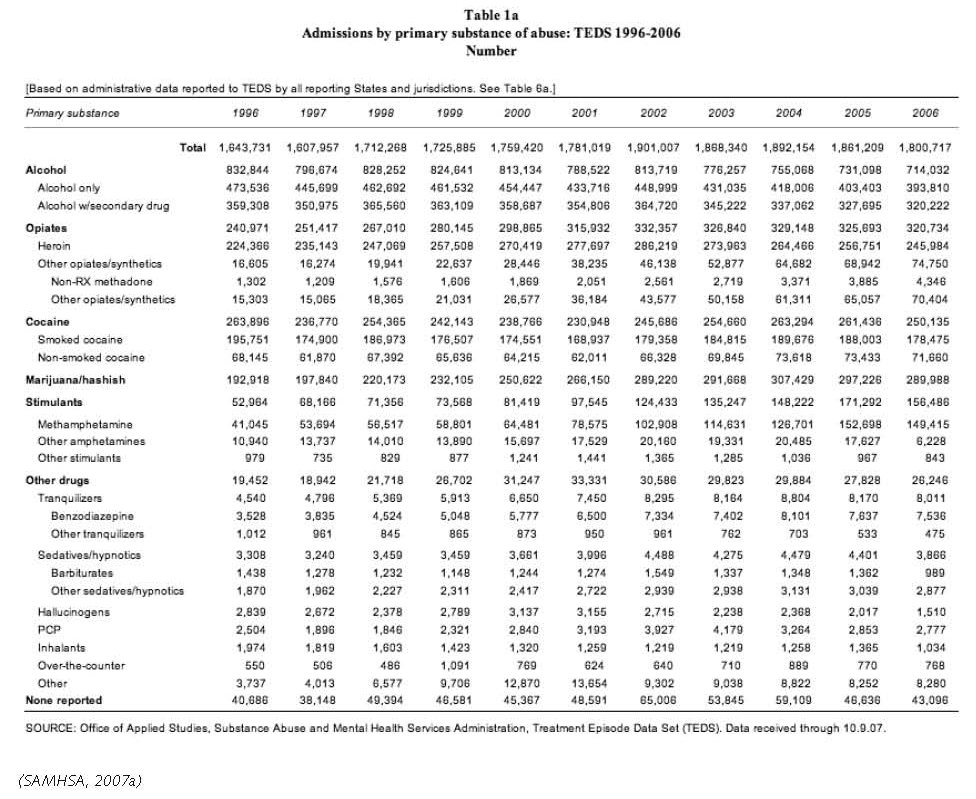
In 2007, the number of persons aged 12 or older needing treatment for problems with illicit drug use was 7.5 million (3.0 percent of the total population). Of these, 1.3 million (0.5 percent of the total population and 17.8 percent of the persons who needed treatment) received treatment at a specialised drug treatment facility in the past year. These estimates did not change significantly between 2002 and 2007. The number of persons needing treatment for problems with illicit drug use in 2007 (7.5 million) was similar to the number needing treatment in 2002 (7.7 million), 2003 (7.3 million), 2004 (8.1 million), 2005 (7.6 million), and 2006 (7.8 million). Also, the number of persons needing but not receiving specialised treatment in the past year for problems with illicit drug use in 2007 (6.2 million) was similar to the estimates in 2002 (6.3 million), 2003 (6.2 million), 2004 (6.6 million), 2005 (6.3 million), and 2006 (6.2 million) (SAMHSA, 2007).
In the criminal justice system, diversion schemes exist offering the option of drug treatment enforced by a court sentence as an alternative for a prison sentence. These diversion schemes are linked to so-called drug (treatment) courts (DTCs) and are only available for non-violent offenders with drug problems (The White House, 2008).

Methadone maintenance was pioneered in the United States in the mid-1960s, and has a long tradition in the country. In October 2002, buprenorphine was also approved for use by the Food and Drug Administration. Despite this early start with Opiate Substitution Treatment, there are major geographical differences in service provision. Historically, expansion of methadone programmes in the United States has been hindered by restrictive licensing and control; misinformation about the nature of the treatment among local communities, health care providers and the public; and fears that methadone clinics would create centres for crime and drug trafficking. It was estimated in 2000 that only 20% of US heroin users were receiving methadone (IHRA, 2008).
Priorities of drug treatment covered by policy papers and/or law
Guidelines for standards of care exist on national, state and local level. These guidelines are mandatory regulations for the Opioid Drugs in Maintenance and Detoxification Treatment of Opiate Addiction. Otherwise, the country indicates that application of the standards of care for drug abuse treatment is not required by law (OAS/CICAD, 2006).
Most important statements
“Stopping drug use before it starts” addresses the prevention priority, stopping drug use before it starts, and details efforts to expand and amplify the cultural shift away from drug use, especially among young people (The White House, 2008).
There have been no changes in these drug policy statements (objectives) during the past ten years (expert’s comments).
3.4 Harm reduction
3.4.1 HIV and mortality

Additional information
Community-based outreach in HIV prevention programmes specifically targeting people who use drugs exist in the United States, including programmes run by and for people who use drugs. A number of cities in the United States have developed mobile harm reduction units that provide syringe exchange, condoms, VCT and other health-related services to street-involved populations of sex workers and people who use drugs. However, significant gaps still exist. Harm reduction advocates identify the need for interventions to address issues such as race, ethnicity, culture, gender, sexual orientation, age and socio-economic status in order to increase accessibility (IHRA, 2008).
In the United States, so-called Needle and Syringe Programmes (NSPs) began in the mid- to late 1980s as unofficial, activist based projects. However, over time, many states introduced legislation to allow NSPs to operate legally and to provide funding support for their implementation. As of November 2007, a total of 185 NSPs were operating in thirty-six states and the District of Columbia.
There has been an increase of funding at the state and local levels for NSPs in recent years, which has resulted in the number of programmes stabilising and their services expanding. For example, in 2006 the North American Syringe Exchange Network (NASEN) recorded 166 registered NSPs in the United States, compared with 68 in 1994/1995, 101 in 1996, 113 in 1997, 131 in 1998, 154 in 2000, 148 in 2002 and 174 in 2004. However, despite this increased access, the Harm Reduction Coalition estimates that NSPs still reach less than 20% of people who inject drugs in the US. The United States government has placed a ban on federal funding for NSPs since 1988. The bulk of funding for these programmes (74 to 87%) therefore comes from city, county and state governments. State support of NSPs is essential in enhancing service provision, and research has shown that the presence of government funding of NSPs in the US is associated with a larger number of syringes being exchanged and a greater variety of services being offered by the programmes, including increased likelihood of offering voluntary HIV counselling and testing (VCT)(IHRA, 2008).
Pharmacy sales of syringes to injecting drug users are limited in the United States by laws, regulations and pharmacy practices. For example, in 2002, forty-seven states and the District of Columbia had enacted drug paraphernalia laws under which the distribution and possession of any item used to consume illegal drugs, including syringes, is prohibited. In addition, eight states also require prescriptions in order to purchase syringes legally. Pharmacy regulations or guidelines in twenty-three states also have the effect of restricting the sale of syringes to people who inject drugs (IHRA, 2008).
Safer crack kits also form part of the harm reduction response in the United States. In 2006, the Beth Israel Medical Center Survey of US Needle and Syringe Exchange found that out of 150 responding programmes, 51 programmes (34%) stated that they had distributed safer crack use kits that year. Safer crack use kits are available from programmes in a number of cities including New York City, Bridgeport, Hartford, Providence, Marin County, San Francisco, Seattle, Chicago, Los Angeles, Minneapolis and Albuquerque (IHRA, 2008).
Priorities of harm reduction covered by policy papers and/or law
In October 2007, the extension of the United States’ national strategy on HIV prevention contained the objective to ‘increase the proportion of people who inject drugs who abstain from drug use or, for those who do not abstain, use harm reduction strategies to reduce risk for HIV acquisition or transmission’. In addition, the 2001 National Hepatitis C Prevention Strategy supports harm reduction. According to the plan, achieving the goal of reducing HCV incidence ‘requires: 1) harm reduction programs directed at persons at increased risk for infection to reduce the incidence of new HCV infections’. However, the National Drug Control Strategy does not support harm reduction (IHRA, 2008).
The federal government provides financial and technical support for HIV prevention, treatment and care through the President’s Emergency Plan for AIDS Relief (PEPFAR) to levels exceeding any other national government. However, PEPFAR funds are not permitted to be used for NSPs and although OST programmes can be supported by these funds, PEPFAR guidelines only allow OST to be provided to people living with HIV.
3.4.2 Crime, societal harm, environmental damage
No information found on crime, societal harm, environmental damage.
References
Consulted experts
P. Reuter, Senior Economist, RAND.
Documents
CD, CDC Wonder System: Available: www.briancbennett.com/charts/death/drug-ind-death.html, last accessed 15 December 2008.
CIA. The World Factbook: United States. Available: www.cia.gov/library/publications/the-world-factbook/geos/us.html, last accessed 10 December 2008.
Hindelang Criminal Justice Research Center. Sourcebook of Criminal Justice Statistics 2003, Sourcebook of Criminal Justice Statistics, University at Albany, 2005. Available: http://www.albany.edu/sourcebook/pdf/t440.pdf, last accessed 15 December 2008.
IHRA (International Harm Reduction Association). Global state of harm reduction 2008. Mapping the response to drug-related HIV and hepatitis C epidemics. London, 2008.
Kung H-C, Hoyert DL, Xu J, Murphy SL. National Vital Statistics Reports (NVSS), CDC,Volume 56, Number 10 April 24, 2008 Deaths: Final Data for 2005 by.; Division of Vital Statistics. Hyattsville, 2008.
Marijuana Policy Project. Washington, D.C. 20013. Available: www.mpp.org/library/medical-marijuana-overview.html, last accessed 15 December 2008.
Mathers BM, Degenhardt L, Phillips B, Wiessing L, Hickman M, Strathdee SA, Wodak A, Panda S, Tyndall M, Toufik A, Mattick RP, for the 2007 Reference Group to the UN on HIV and Injecting Drug Use. Global epidemiology of injecting drug use and HIV among people who inject drugs: a systematic review. Vienna, 2008.
OAS/CICAD (Organisation of American States/Inter-American Drug Abuse Control Commission). United States of America. Evaluation of Progress in Drug Control 2005/2006. OEA/Ser.L/XIV.6.2; MEM/INF. 2006 Add 7.
ONDCP (Office of National Drug Control Policy). What America’s Users Spend on Illegal Drugs 1988-1998. Washington, D.C., 2000.
ONDCP. The Price and Purity of Illicit Drugs: 1981 Through the Second Quarter of 2003. Washington, D.C., 2004.
SAMHSA (Substance Abuse and Mental Health Services Administration). National Household Survey on Drug Abuse 1998: National household survey on drug abuse, main findings. Rockville, MD, 1998.
SAMHSA, National Survey on Drug Use and Health: National Findings. Rockville, MD, 2007.
SAMHSA, Office of Applied Studies. Treatment Episode Data Set (TEDS) Highlights - - 2006 National Admissions to Substance Abuse Treatment Services. OAS Series #S-40, DHHS Publication No. (SMA) 08-4313, Rockville, MD, 2007a. Available: www.oas.samhsa.gov/TEDS2k6highlights/toc.cfm, last accessed 15 December 2008.
The White House. National Drug Control Strategy. 2008 Annual Report. Washington, D.C., 2008.
UNAIDS. Status of the Global HIV epidemic. 2008 Report on the Global AIDS epidemic, Joint United Nations Programme on HIV/AIDS (UNAIDS), Geneva, 2008.
UNDCP (United Nations International Drug Control Programme). Global Illicit Drug Trends 2000. Statistics. Vienna, UNDCP, 2001.
UNODC (United Nations Office on Drugs and Crime). World Drug Report 2007. Vienna, UNODC, 2007.
UNODC. World Drug Report 2008. Vienna, UNODC, 2008.
UNODC. Amphetamines and ecstasy. 2008 Global ATS Assessment. Vienna, UNODC, 2008a.
| < Prev |
|---|


