Annex 1 Farm-gate and international trade values for cocaine and opiates
| Reports - A Report on Global Illicit Drugs Markets 1998-2007 |
Drug Abuse
Annex 1 Farm-gate and international trade values for cocaine and opiates
This annex discusses the production and trafficking of cocaine and opiates, with a focus on the value of the global farm-gate
market and the value associated with exporting cocaine and opiates to consumer countries. The key findings are as follows:
• The annual global farm-gate value for opium and coca combined is likely to be no more than $3 billion. While this is a
very small fraction of total retail spending, cultivation does account for a non-negligible share of GDP in some producing
countries (e.g., Afghanistan, Bolivia).
• While Mexico accounted for only 0.5% of total opium production in 2006, it accounted for at least 25% of the global
farm-gate revenue.
• There is substantial disagreement about the amount of coca cultivated in Colombia, the world’s largest producer. While
other scholars have noted this difference, the growing size of the discrepancy is noteworthy. In 2007, the United Nations
Office on Drugs and Crime estimate (99,000 hectares) was dramatically lower than the estimate offered by the United
States Government (157,200 hectares).
• Exporting cocaine hydrochloride from Colombia to consuming countries generates a value of no more than €10B annually
(import price-replacement cost). We think that the value of the opium trade is close to the upper bound of this range, but
there is difficulty in generating reliable estimates for the import values.
1 Cocaine
Three nations in South America account for the vast majority of the global production of coca: Bolivia, Colombia, and Peru.
Colombia cultivates and processes most of the coca, and much of the cocaine hydrochloride consumed in Europe and North
America passes through Colombia at some point (UNODC, 2008a). Over 90% of the cocaine destined for the United States and
Canada also passes through Mexico. As for Europe, Spain and Portugal serve as the main entry points (UNODC, 2008a).
1.1 Farm-gate
While Colombia’s dominant role in the cocaine trade is undisputed, there is substantial disagreement about the amount of
coca cultivated in Colombia. Noting the difference between official figures for the United Nations Office on Drugs and Crime
(UNODC)47 and the United States Government (USG) is not novel (see e.g., Thoumi, 2005), but the growing size of the
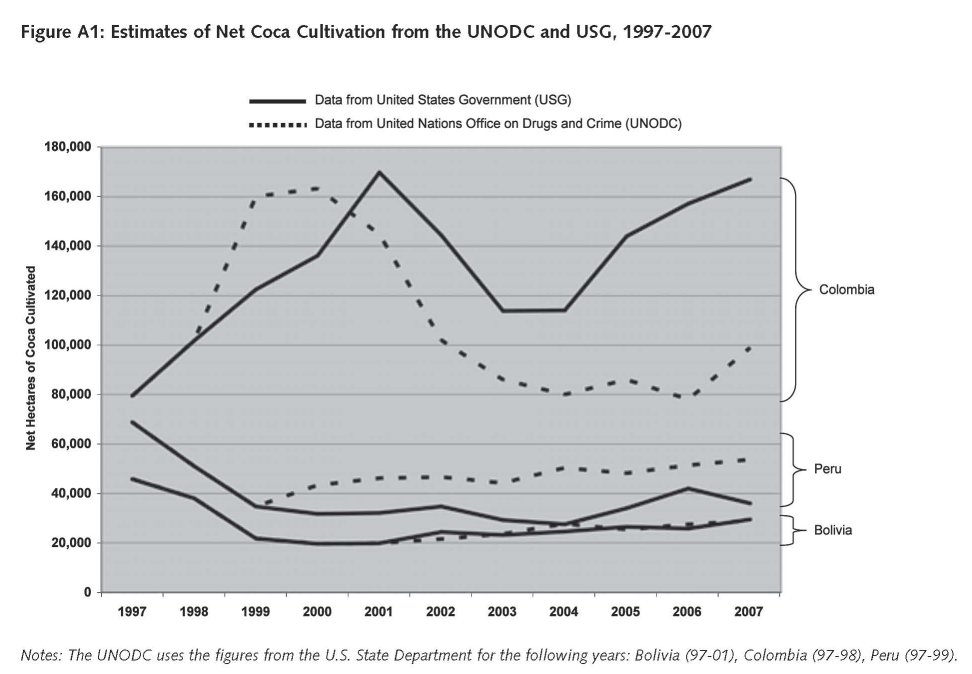
discrepancy is noteworthy. Figure A1 displays the hectares of cultivated coca in Colombia from 1997 to 2007, with the solid
line representing USG estimates and the dotted line representing UNODC.
The estimates for 1997 and 1998 are identical since the UNODC uses the USG’s figures for those years. For 1999 and 2000,
the UNODC figures of 160,000 hectares exceeded USG estimates by 40,000 hectares. But beginning in 2001, the USG
estimates exceeded the UN and the difference has grown over time. In 2007—the most recent year for which we have data
from both sources— the UNODC estimate (99,000 hectares) was dramatically lower than the estimate offered by the USG
(157,200 hectares). While the USG did make methodological changes in 2006 (increased the survey area by 19% over the
survey area for 2005), these changes do not explain why the gap increased 70% between 2004 and 2005.

Figure A1 also presents the estimates from Bolivia and Peru and it helps put the Colombian discrepancies into context.
The difference in the UNODC and USG figures for coca in 2004 is comparable to the entire output of Bolivia; in 2006 the
difference is greater than the output of Bolivia and Peru. There is also a discrepancy in the figures for Peru, but it is not in
the same direction. The USG figures for Peru have hovered around 33,000 hectares from 1999 to 2007 (except for a recently
revised blip in 200648) while the UNODC figures have steadily increased from 34,000 in 1999 to 53,000 hectares in 2007.
The figures for Bolivia have been fairly similar over time.
While the UNODC figure for cultivated hectares in Colombia has decreased by nearly 50% since the late 1990s, the
UNODC does not report a similar decrease in cocaine production. This is because the average yield has almost doubled,
which has offset the reduction in hectares (UNODC, 2008; Mejia and Posada, 2008).49 Using regional level data collected
by the UNODC and insights from the U.S. about how to convert estimates of cocaine base into cocaine, the UNODC
estimated that Colombia produced 610 metric tons of pure cocaine in 2006. Interestingly, the USG also reports this
610 metric ton figure, even though its estimate of the net coca cultivation was twice the UNODC value.50 The USG’s
International Narcotic Control Report (2008) does not describe how this figure was calculated, but in all likelihood it is
based on the UNODC. Perhaps more interesting, the USG’s 2009 National Drug Threat Assessment (NDIC, 2008) reports
this figure to be 540 metric tons for 2006. This is perplexing since one would assume that the revised USG figures would
be higher, not lower, given the cultivation discrepancy. This raises important questions about how much stock should be
placed into these estimates.
These discrepancies also raise important questions about the farm-gate value. The UNODC estimates that the farm-gate
value of coca cultivation increased from $1.16 billion in 2006 to $1.44 billion in 2007 (UNODC, 2008c). For each country,
the UNODC reports the number of cultivated hectares for a region as well as the region-specific yield (and sometimes
region-specific price per kg). 51 Focusing on 2006, the distribution for the $1.16 billion generated by the UNODC is $683 M
from Colombia, $285 M for Peru, and $180 for Bolivia. Unlike Bolivia and Peru, the value for Colombia is not exclusively for
coca leaf since many farmers dry and process the leaves into paste on the farms (Table 1). Thus, the actual farm-gate value
for coca leaves would be lower than this estimate.

1.2 Value associated with exporting cocaine to consumer countries
The vast majority of cocaine is consumed in North America and Europe. Based on prevalence, North America accounts for 44%
and Europe accounts for 25% of past-year users (UNODC 2008). Further, the UNODC’s input/output model suggests that North
America and Western & Central Europe account for over 75% of the cocaine consumed circa 2003 (UNODC, 2005).
Table A2 presents a stylized but credible model of the value of the international cocaine trade. Since we only focus on
consumption in North America and Western and Central Europe, this figure is an underestimate of the total amount; however,
there should not be a dramatic difference between this stylized value and the actual value of the international cocaine trade
since these regions account for the vast majority of consumption and revenue for traffickers. For these calculations we use
figures from the UNODC input/output model published in the 2005 World Drug Report (UNODC, 2005) which reports the
amount of cocaine intended for each region (after accounting for seizures within the source country) as well as the amount
that is seized or lost in transit.

Since the vast majority of cocaine consumed in the world is processed in and/or transported though Colombia (UNODC,
2008a), we consider the price per kilo in Colombia to be the export price. The UNODC reports that a kilo of cocaine in
Colombia in the main cities was $1,762/kg in 2006 and $2,198/kg in 2007. This is consistent with the $1,500 figure reported
by Caulkins & Reuter in 1998. We use $2,000 for this stylized model and note that this figure is largely inconsequential to
the value of trade since the import values are so much larger.
The import price for a kilogram of cocaine in the United States has been reported to be $15,000-$23,000 by a variety of
sources (e.g., Caulkins & Reuter, 1998; Thoumi, 2005; Reuter, 2008). We use these values as our low and high estimates.
Similar to the U.S., the import price in Europe will depend on the location and method. Unfortunately, we are not aware of
any estimates of the average import price for a kilo of cocaine in Europe. Based on interviews with drug dealers, the Matrix
Working Group (2007) estimates that a kilo of cocaine entering the UK is valued at £30,600 GBP (£2006), or ~$45,000. This
is similar with figures from the Spanish police that a kilo of cocaine in Madrid in the first half of 2007 cost almost $44,000
(Schoofs & Prada, 2008), although it is not clear if this is the import or wholesale price. Since these figures are close to the
average wholesale price for cocaine in Europe circa 2005 (UNODC, 2006), we consider $45,000 an upper bound for the
European import price since the import price should be lower than the wholesale price because of the additional risk and
possible transportation costs. Since this upper bound happens to be almost exactly twice the upper bound used for the U.S.,
we double the U.S. lower bound to generate a lower bound for Europe ($30,000/kg).
This stylized model suggests that the annual value of the cocaine trade (i.e., the revenue generated by shipping it from Colombia
to Europe and North America) is likely to be between $7 billion and $11 billion (€6 billion and €9 billion). This value can include
transportation costs, payoffs, compensation for trafficker risk, and other mark-ups. As previously mentioned, this model does
not cover all consuming countries, but it accounts for those where the most of the trafficker revenue is generated.
2 Opiates
Afghanistan and Burma account for over 90 percent of the global production of opium (UNODC, 2008a). Afghanistan
cultivates the vast majority of opium and some claim that up 90% of it is converted to heroin or morphine in Afghanistan
before it is exported throughout the world (UNODC, 2007d). While the most of the heroin consumed in North America is
believed to come from Colombia and Mexico, heroin from Asia is available, especially on the East Coast of the country (NDIC,
2008; Paoli et al., 2009).52
2.1 Farm-gate
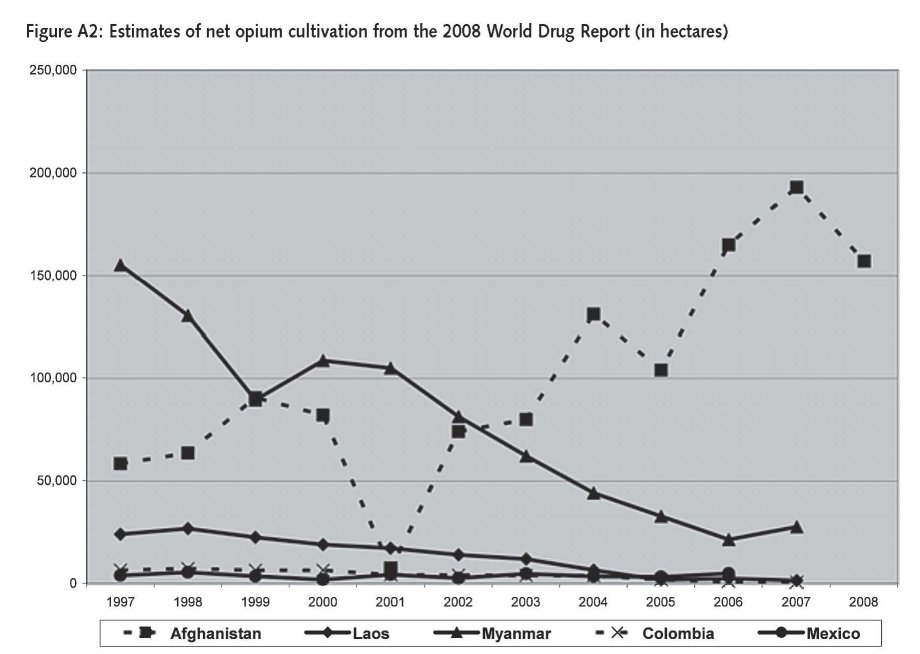
Figure A2 displays the net opium cultivation for Afghanistan, Burma, Laos, Colombia, and Mexico as published in the WDR.53
Between 1997 and 2000, well over 200,000 hectares of opium were cultivated in these countries each year, with the majority
coming from Myanmar (except in 1999 when the output was similar to Afghanistan). Colombia and Mexico together
accounted for 9,000-12,000 hectares during this time. With the Taliban opium ban circa 2001, opium poppy cultivation was
nearly eliminated in Afghanistan, thus driving the worldwide output below 150,000 net hectares. As cultivation rebounded in
the subsequent years, Afghanistan quickly overtook Burma as the cultivation leader. By 2007, Afghanistan accounted for well
over 80% of the global opium cultivation. Data for 2008 are currently only available for Afghanistan and it shows a significant
drop in cultivation (nearly 20%). Whether or not this is the beginning of a trend remains to be seen.
The calculation for Mexico is slightly more involved. The 2008 WDR suggests that there were 5,000 net hectares of opium poppy
cultivated in Mexico in 2006. As for the yield, the NDIC (2007) estimates approximately 20kg of opium gum per hectare circa
2006.54 With estimates of the farm-gate price for opium in Mexico being typically $2,000 to $5,000 per kilo (Reuter, 2008), this
suggests the farm gate value can range from $200M to $500M. The UNODC reports 1,023 net hectares of opium poppy cultivated
in Colombia in 2006, and 714 in 2007 (UNODC, 2008a). Based on data from the UNODC, the average farm-gate price in Colombia
was much cheaper than reported for Mexico: $251/kg in 2006 and $286/kg in 2007. Assuming a yield roughly similar to Mexico
(which is slightly higher than the yield in Afghanistan and Burma), this would generate a farm-gate value around $60M.
These values suggest the 2006 global farm-gate value of opium could range between $1B to $1.6B, with a midpoint of
$1.3B. While Mexico accounted for only 0.5% of total opium production in 2006, it accounts for a much larger share of
the global farm-gate revenue. Using the midpoints of these ranges for 2006, Mexico accounted for more than 25% of the
global farm-gate revenue.

Not surprising, the global farm-gate value of opium is dominated by Afghanistan. The UNODC estimates the 2006 and 2007 values for
Afghanistan $760M (90% Confidence Interval: $601M - $885M) and $1B ($901M - $1090M), respectively. For Southeast Asia, the
UNODC reports the “total potential value of opium production”, which was $85M in 2005 and $133M in 2006.
2.2 Value associated with exporting opiates to consumer countries
The section presents an estimate of the value associated with exporting opiates to consumer countries. Unlike the calculations for
cocaine, one cannot simply use the export prices and quantity for one country as was basically done for cocaine. These estimates
focus on two producing regions (Asia and South America) and three consuming regions (Europe, North America, and Asia).
The lack of data preclude us from generating anything more than a stylized example. The goal is not to generate a precise
estimate; rather, the goal is to understand the magnitude of the value added by moving the product to the consuming country.
For Afghanistan, the UNODC notes “The average export price of heroin in the border regions of neighbouring countries fell from
US$ 3,860 per kg in 2005 to US$ 3,394 in 2007 and US$ 3,284 in 2008.” Since the Afghan border is quite porous, it seems
unlikely that the export value of heroin refined in Afghanistan would be dramatically lower. The UNODC reports that a wholesale
price of a kilogram of heroin in Mexico was $35,000 in 2006 (UNODC, 2006). Given the large difference in the price estimates for
the farm-gate values for opium gum in Mexico and Colombia, we would expect the heroin prices in Colombia to be lower. Indeed,
the UNODC reports that the average price of a kilo of heroin was $9,070 in 2006 and $9,992 in 2007 (UNODC, 2008c).
2.2.1 Europe
We begin by considering the wholesale price in Europe, which we believe to be higher than the import price. The 2008 WDR
reports the wholesale price of a kilogram of heroin in Europe is $31,000. Reuter (2008) presents a wholesale value of $50,000
in London (based on other sources), which is consistent with this estimate since the wholesale price should be larger than the
import price. Based on interviews with drug dealers, the Matrix Working Group (2007) estimates that a kilo of heroin entering
the UK is valued at £20,500 GBP (£2006), or ~$30,000. Thus consider a range of $30,000-$50,000.
2.2.2 North America
The 2008 WDR reports the wholesale price of a kilogram of heroin in the United States is $88,000. This is much higher than
the estimate from the DEA Albuquerque office suggesting that heroin from Mexico was $40,000 in 2002 (NDIC, 2002).55
2.2.3 Asia
Generating an import value for Asia is very difficult. First, many of the countries are producers as well as consumers. Second,
since the Afghan borders are porous it is difficult to discern the export and import prices in some cases. Third, a significant
share of opiate users in Asia use opium instead of the more expensive heroin.
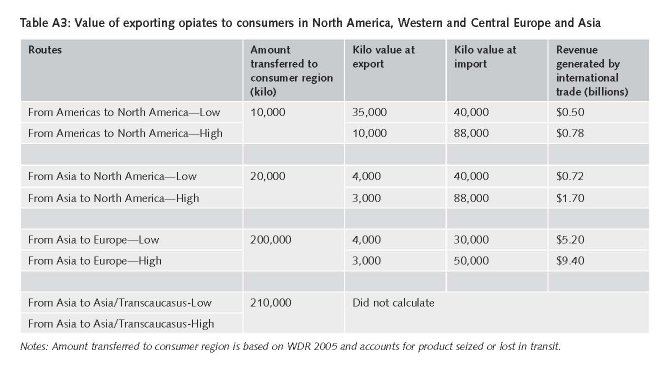
Table A3 presents a stylized model of the trade value generated from exporting opiates. To generate the estimates we subtract
the export value from the import value and multiply this by the amount transferred to the region. The value associated with
exporting opiates to Europe and North America is at most €10 billion, with Europe accounting for the vast majority of the
trade. We do not generate an estimate for intra-Asian trade because of the aforementioned complexities, but do note that
approximately 210,000 kg were transferred within the region circa 2003. Few would argue that the average trade mark-up in
Asia would exceed Europe, thus we apply the European trade value to generate an upper bound (approx €40,000 per kilo).
Even at this extreme and implausible value, the global value of exporting opiates would not exceed €20 billion.

47 UNODC sources for this section on cocaine: UNODC 2007a, UNODC 2007b, UNODC 2008a, UNODC 2008c.
48 The USG figure for Peru was updated from 34,000 to 42,000 for 2006 in the 2009 National Drug Threat Assessment (NDIC, 2008).
49 The UNODC attributes the improved yield to improvements in cultivation and conversion techniques: “Due to improved cultivation techniques
and coca leaf to cocaine conversion processes, global cocaine production is at a level similar to those of the late 1990s, although the area under
coca cultivation is considerably smaller.” (UNODC, 2008c).
50 “Colombia’s potential pure cocaine production was estimated at 610 MT for 2006” (INCR 2008, 124).
51 Farm gate prices are not necessarily representative (Mejia & Posada, 2008, p 13).
52 2009 National Drug Threat Assessment. “The availability of Southeast Asian heroin in U.S. cities has been very low since 2002 and decreased
further in 2006.” “Data from DEA’s 2005 Domestic Monitor Program, a street-level indicator program, indicates 96 percent of the heroin
originates in Colombia or Mexico.” www.interpol.int/public/Drugs/heroin/default.aspS
53 Since the UNODC often uses figures generated by USG and vice versa for opiates, we do not separately report figures from these organizations.
54 In northern Mexico, opium cultivators yield 23 kilograms of opium gum per hectare, compared with 19 kilograms of opium gum per hectare in
southern Mexico. www.usdoj.gov/ndic/pubs25/25921/heroin.htm#Top.
55 www.usdoj.gov/ndic/pubs07/803/heroin.htm
| < Prev | Next > |
|---|


