| Reports - Effect of Drug Law Enforcement |
Drug Abuse
RESULTS
Study Selection & Study Characteristics
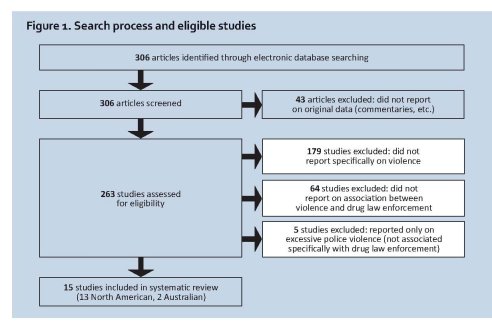
In the initial search, 306 potential articles were identified for inclusion in the review. Of these, 43 (14.1%) were excluded because they did not present new data (e.g., editorials). As a result, 263 (86.0%) articles were retrieved for detailed examination after initial searching of keywords and abstracts. Of these, 248 (94.3%) were deemed non-relevant to the current review for the following reasons: 179 (68%) were excluded based on a lack of explicit mention of violence in the analysis; 64 (24%) were excluded based on a lack of reporting of violence related to drug law enforcement; and 5 (2%) were excluded because they reported on police violence rather than violence associated with drug law enforcement. In the end, 15 (6%) studies were eligible for inclusion in the systematic review. The full extraction process is summarized in Figure 1.

“Many, especially the young, are not dissuaded by the bullets that fly so freely in disputes between competing drug dealers—bullets that fly only because dealing drugs is illegal. Al Capone epitomizes our earlier attempt at Prohibition; the Crips and Bloods epitomize this one.”
Milton Friedman Economist & Nobel Laureate
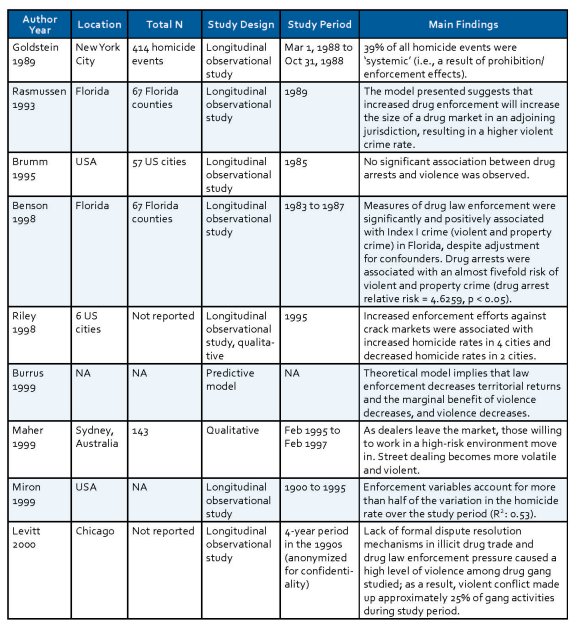
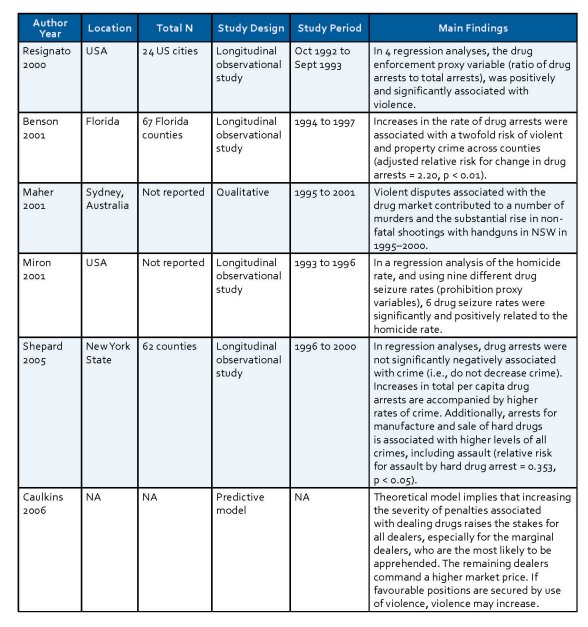
Overall, the 15 studies deemed relevant to the systematic review included 13 (87%) studies from North America6, 13, 23-33 and 2 (13%) studies from Australia. 34, 35 Further, 13 (87%) used quantitative study designs and 2 (13%) used qualitative study designs. One study used a mixed method (i.e., quantitative and qualitative techniques) design. Of the 13 studies that employed quantitative techniques, 11 (85%) conducted regression analyses of real world data, and 2 (15%) presented theoretical models of drug market dynamics. The individual studies are described in Table 1.
Results of Individual Studies
The 11 studies that conducted longitudinal analyses of real world data included violence, violent crime, or homicide as a primary independent variable of interest, and used measures of drug law enforcement as dependent variables of interest. These studies used a variety of proxy variables to quantify drug law enforcement, such as drug arrests as a proportion of total arrests, police expenditure, number of police officers, and drug seizure rates. Contrary to our original hypothesis, in 9 (82%) of the studies that employed regression analysis of longitudinal data, a significant positive association was observed between drug law enforcement in creases and increased levels of violence. 13, 23-25, 27, 30, 31, 33, 36 Only one study (9%) reported no significant association (i.e., no beneficial or negative impact) between drug law enforcement and violence .32 The two theoretical models of drug market dynamics, which used hypothetical data to model the potential impact of law enforcement, reached divergent conclusions: one concluded that increased law enforcement
would decrease violence ,28 while the other concluded that increased law enforcement would increase violence. 26
The two qualitative studies included in this systematic review both reported on health harms among illicit drug users in the open air illicit drug market in Sydney, Australia .34, 35 In these studies, the authors observed that, as dealers exited the illicit drug market, those willing to work in a high-risk environment entered, and street dealing thereby became more volatile .34 Further, the authors noted that the increased volatility associated with street dealing resulted in a higher number of violent disputes, which have contributed to an increase in murders and nonfatal shootings among individuals involved in the illicit drug trade .35
Table 1. Eligible studies on violence and prohibition


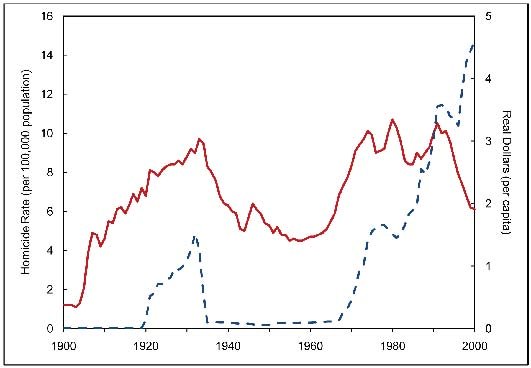
Figure 2. homicide rate (solid red line) and estimated expenditure for enforcement of alcohol and drug prohibition (dashed blue line) in the united States, 1900–2000

S0urces: Vital Statistics of the United States (US Census Bureau, 1975), Statistical Abstracts of the United States (US Census Bureau, various issues), Eckberg (1995), and Annual Budget of the United States, as described in Miron (1999)
Figure 2, from a study by Miron, shows a close association between the amount of money spent on enforcement of prohibition (against first alcohol and later drugs) and the national homicide rate in the United States. This study adjusted for other possible causes of homicide and found that drug law enforcement expenditures remained a strong independent predictor of the homicide rate.
| < Prev | Next > |
|---|


