| Articles - Crime, police & trafficking |
Drug Abuse
Youth Violence, Guns, and the Illicit-Drug Industry
Alfred Blumstein
H. John Heinz III School of Public Policy and Management Carnegie Mellon University
I. The Growing Concern Over Crime
Crime has become an issue of increasing importance to the American public. A growing fear of crime seems to pervade the nation, and that has contributed to crime being reported as the nation’s "most serious problem" in a New York Times/CBS poll2. It is illuminating to examine some empirical aspects of changing crime patterns in recent years in order to identify the nature of those changes more precisely than is possible from the typical press report or the political debate.
A. Changing Crime Rates
If one were to ask the American people in 1994 how the crime problem has been changing in recent years, there seems to be little question that most would claim that crime has been becoming incessantly worse, and especially the violent crimes. This view is reflected in the "most serious problem" rating.
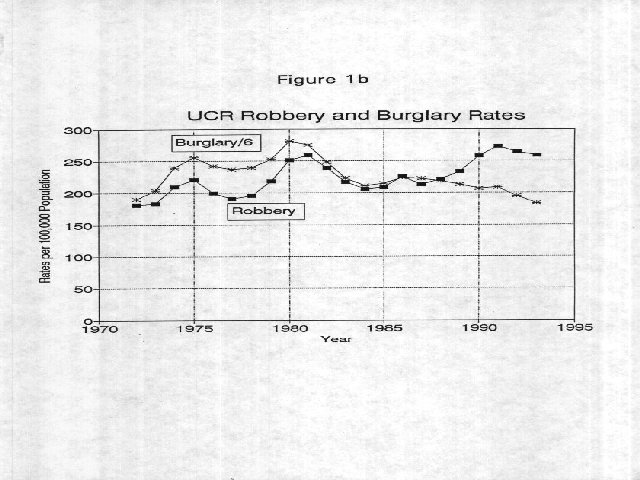
In view of those perceptions, it would undoubtedly come as a surprise to most people to see Figure la 3, the graphs of the most serious violent crimes, murder and robbery, as well as Figure lb, robbery and burglary 4, over the 22-year period from 1972 to 19935. These graphs present a picture that is much more one of oscillation around a strikingly flat trend. They have generally remained within a fairly confined range of 200-250 per 100,000 population for robbery and 8-10 per 100,000 for murder. Both the murder and the robbery rates peaked in about 1980, declined through the early 1980s, and then climbed again during the late 1980s with the spawning of the crack epidemic and the "war on drugs". Over this period, there is no statistically significant trend for murder, a slight upward trend for robbery (an annual increase of 3.0 robberies per 100,000, or 1.35So of the mean robbery rate over the 22 years), and a slight downward trend for burglary (an annual decrease of 10.4 burglaries per 100,000, or 0.77% of the mean burglary rate).
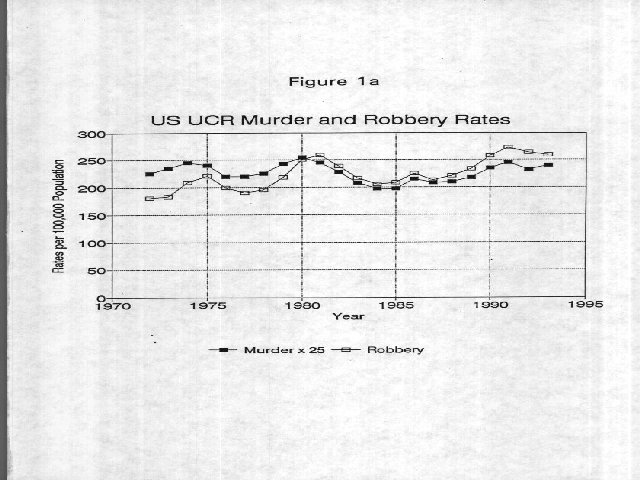 |
The oscillatory pattern for the two major bellwether violent crimes, murder and robbery, is quite similar. Both reached a peak in about 1980 (as the baby boomers began to emerge from the high-crime ages), began a downward trend through the early 1980s. That downward trend was anticipated based primarily on demographic considerations6, and was expected to continue until the early l990’s. Unfortunately? however, that downward trend was interrupted and turned upward through the late 1980’s, probably a consequence of the drug epidemic of that later period. In more recent years, both rates dropped from 1991 to 1992, but then murder increased while robbery decreased from 1992 to 1993; The pattern for burglary also tracked that for robbery rather closely until the late-1980s, when burglary did not turn up, but, rather, continued a slow decline. If the crime rise in the late 1980s was driven by the growth in the drug‘ markets, and if the crimes of theft were strongly influenced by the need to get money to buy drugs, then the divergence might be explained by the realization that a robbery is a quick and convenient way for a drug user not earning his money from selling drugs to get his drug money. In contrast, a burglar still has to dispose of his property, through a fence or otherwise, and users in urgent need of drugs may choose to avoid that complication.
 |
B. Demographic-Specific Rates The aggregate rates reflect a combination of changes in the crime-committing propensity of particular demographic groups with changes in demographic composition, particularly in the numbers of those demographic groups with relatively high crime involvement. One can partition those factors by examining changes in demographic-specific rates. The three principal measured demographic variables - age, race, and gender - each accounts for large differences in involvement in crime. The measure that accounts for the most difference is gender, but it is less useful to explore because gender composition is not changing appreciably. On the other hand, because age is one of the most important factors affecting crime rates - and is also one that has been changing significantly in recent years - it is useful to examine age-specific crime rates. Race is also an important factor, especially in violent crimes, and so we explore that factor also in this section.
 |
1. Age Age is so fundamental a construct that its relationship to offending is usually designated as the "age-crime curve". These are graphs as a function of age of the ratio of the number of people of each age who are arrested for crime type i, Aji(a), to the total population of that age7, Ni(a).
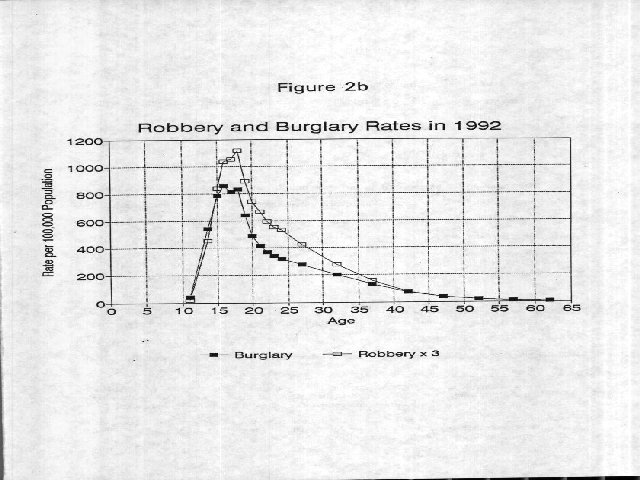 |
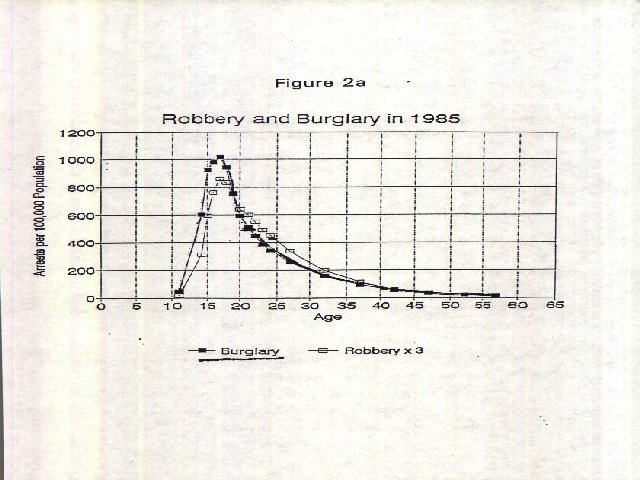
a. Robbery and Burglary Figures 2a and 2b contrast the patterns for robbery (scaled up by a factor of 3) and burglary in 1985 and in 1992. First, we note that both crimes peak fairly early at about age 17, and fall off rather quickly, reaching their half-peak points in the early 20s - about age 21 for burglary and about age 24 for robbery. This suggests that people start committing robbery a bit later than burglary, and also finish somewhat later. But, clearly, careers in both tend to terminate at a relatively young age. The pattern for robbery and burglary for 1992 depicted in Figure 2b is very similar to the 1985 picture in Figure 2a. The burglary peak has dropped somewhat, and the robbery peak increased, an observation that is consistent with the earlier observations about the aggregate rates in Figure lb. This suggests that the changes in the age-specific rates is a principal factor affecting the aggregate rates. Aside from that shift, however, the two patterns are very similar in the two periods. The information in these age-specific patterns is particularly relevant to the various proposals for life sentences without parole for people convicted of a third felony (popularly known as the "three strikes and you’re out" laws), especially if the felonies counted as "strikes" include burglary. It is particularly relevant to note how few burglars appear at age 50, the age at which life expectancy is still about 25 years, especially with the good care an ex-robber/lifer is likely to get in prison. A similar consideration also applies to robbery, with somewhat less strength. This argues for limiting the "strikes" to only serious violent offenses, which do display longer duration to their criminal careers8.
|
b. Murder
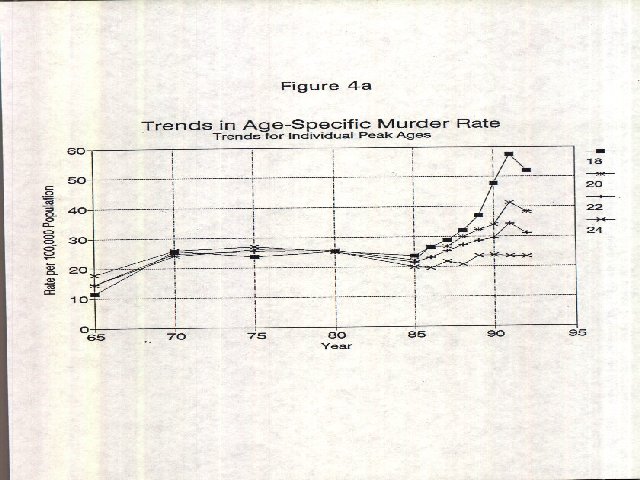
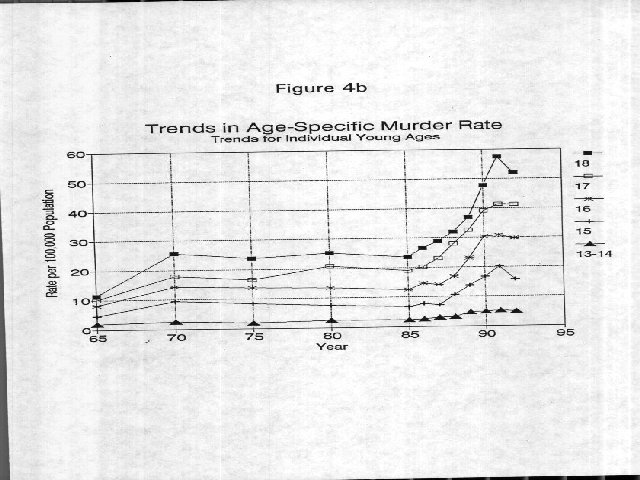
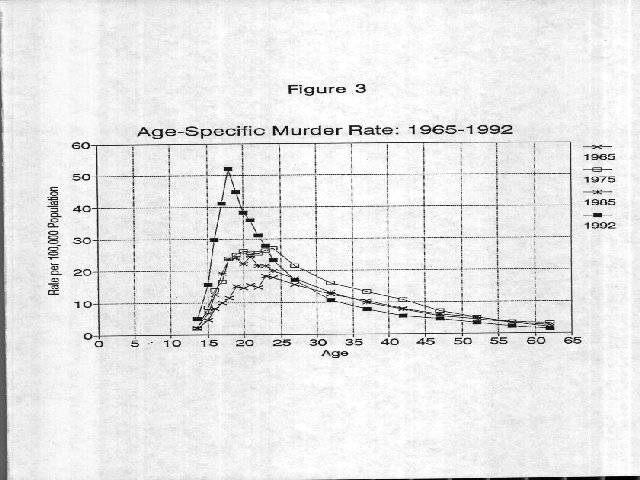
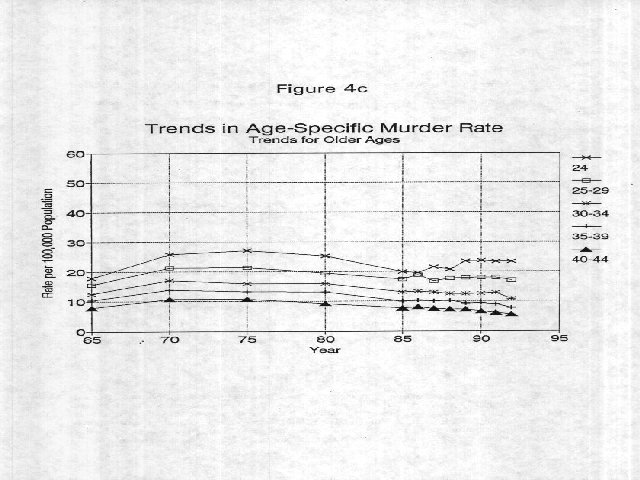
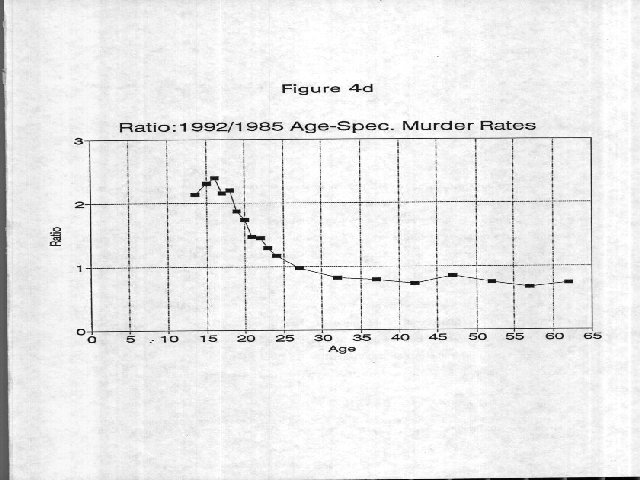
The trends in the age-specific patterns for murder, are in marked contrast to those for robbery and burglary, having changed appreciably over the last decade. Figure 3 presents five graphs of the shift in age-specific murder rates from 1965 through 1992. There has been a marked change from the fairly flat-peaked patterns of 1965 through 1985, with the peak flat between ages 18 and 24, and the later shift to the pattern that is sharply peaked at age 18 of 1990 and 1992. That picture is illuminated in Figure 4a9, which depicts the shift over time in the age-specific rates for the individual ages from 18 through 24, the ages around the peak of the graphs in Figure 3. First, we can see the general increase in murder rates at all ages from 1965 to 1970. Second, we note that the murder rate at all ages from 18 through 24 was virtually the same for the fifteen-year period from 1970 through 1985; this reflects the relative flatness of the peak of the graphs for those years in Figure 3. Third, we note that for age 24, there was no strong trend (perhaps a slight downward trend) from 1970 through 1992. Figure 3 confirms that this stability over this period is largely the case for all the ages beyond 24. Indeed, there may even have been a reduction of the rates for those older ages in 1992. Finally, we note that there were increases in the murder rates for the ages younger than 24 beginning shortly after 1985, and the rate of increase was inversely related to age. For 18, the consistent peak age in Figure 3, the increase from 1985 to 1992 was over 100%. This shift to younger ages is displayed even more vividly in Figure 4b, which presents the age-specific arrest rates for murder for each age from 18 down to the combined group of 13 and 14. For 16-year-olds, for example, whose murder rate prior to 1985 was consistently about half the rate of all the others shown in Figure 4a, their increase from 1985 to 1992 was 138%. Even the 13-14-year-olds, whose rate is still low enough for them not to be a significant contributor to total murders, about doubled their murder rates between 1985 and 1992. It is clear that, following a period of relative stability from 1970 through 1985, there was a major increase starting just after 1985 in the murder rate by young people. That increase has not at all been matched by increases in the older groups of 24 and beyond, as shown in Figure 4c. Indeed, Figure 4d, which depicts the ratio of the age-specific murder rates in 1992 to that in 1985 highlights the fact that all rates for 18 and under have doubled, and those For 25 and older have declined somewhat. Thus, much of the growth in the homicide rate in the late 1980s shown in Figure 1 is attributable to the spurt in the murder rate by young people since 1985. This is in marked contrast to the growth between 1965 and 1970, which was largely an across-the-board increase at all ages. The "excess murders" attributable to the rise in murder rate by the young people (15 through 22) from 1986 through i992 is a non-trivial component of the murders in that period10. It is estimated at 18,600 murders for those 7 years and 8 ages, or 2660 murders per year; this is 12.1% of the annual average of 22,000 murders in those years, or an increment of 43.2% over the base number of ¢,150 murders attributable to those 8 ages if the pre-1985 rates prevailed. In one year alone (1991), these 8 ages generated an excess of 5,330 murders, or 21.6% of the total of 24,703 reported in the 1991 UCRll. Eighteen-year-olds alone contributed 4,000 of the excess murders in the seven years.
 |
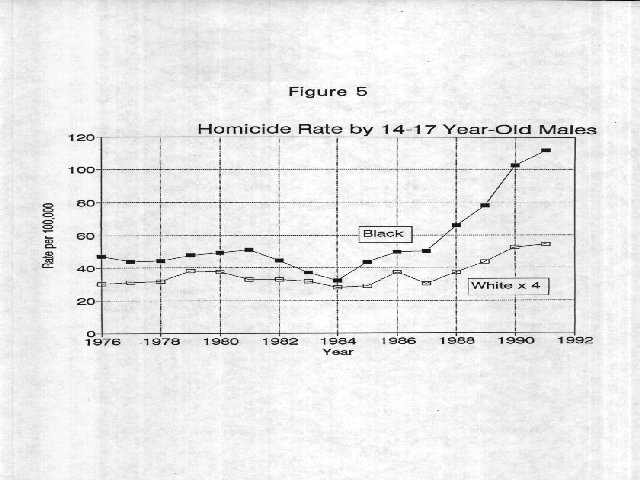
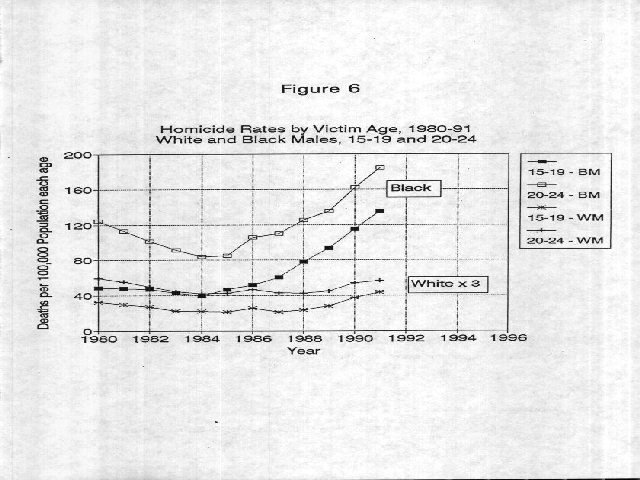
2. Race The race composition of the US population has also been changing in major ways in recent years. While "race" is a variable that is widely measured, it is important to recognize that "race" has no theoretical meaning in itself; it combines effects associated with differences between the races in family structure, economic opportunity, community culture, discrimination experiences, and many other individual and group factors that distinguish races - and especially blacks from whites - in America. The crime types in which white and nonwhite rates differ most markedly are robbery and murder. Figure 512, which displays the homicide rate by males in the 14-17 age range, highlights the race differences, both in level and in rate of change since 1985. The figure shows the major growth in the rates of homicide since 1985, especially for these young black males and their important contribution to the growth in the teen-age age-specific murder rates of Figure 4. The annual rate for whites had averaged 8.13 homicides from 1976 through 1987, and then they climbed rapidly, almost doubling in the next four years, from 7.6 % in 1987 to 13.6 % in 1991. The rates for black males more than doubled in those four years (from 50.4 in 1987 to 111.8 in 1991), and tripled from 32.0 per 100,009 in 1984 to 111.8 in 1991. Figure 6 13 highlights the fact that victims and perpetrators tend to be very similar demographically. The growth in young males as perpetrators of homicide (Figure 5) is clearly reflected in their growth as victims in Figure 6. Similar growth in victimization is not reflected in older ages.
 |
C. Two Aspects that Generate Fear: Strangers and Guns Even though aggregate homicide rates have not increased dramatically in recent years (see Figure 1), there have been some important shifts in the nature of homicides, and these shifts have undoubtedly contributed to the growing concern over crime. One facet of the shifting pattern is the major increase in the murders by the very young, as shown in Figures 4 and 5. This raises concern because of the general perception of a greater recklessness associated with teenagers than with older adults.
 |
1. Strangers A second facet causing concern is the greater degree to which homicide by the young is committed against strangers. Drive-by shootings are particularly distressing in this regard because it can appear that the target was chosen at random, and that innocent bystanders may be hit in any event, and so any person’s concern about his or her vulnerability is heightened. Since most murders have always been a result of conflict between intimates, people who are confident about their intimates’ non-violent nature need not become alarmed when that murder rate goes up. But when there is a sense that more murders are being committed against strangers, then any person can conceive of himself as a potential target. Murders by young people are much more likely to be targeted against strangers. During 1976-1991, only 20 percent of all homicides were between strangers, whereas 34 percent of those committed by male juveniles were between strangersl4. Thus, the perception of the random nature of the growth in murders is reinforced by this difference in the relationship between offender and victim associated with the shift to the younger offenders.
 |
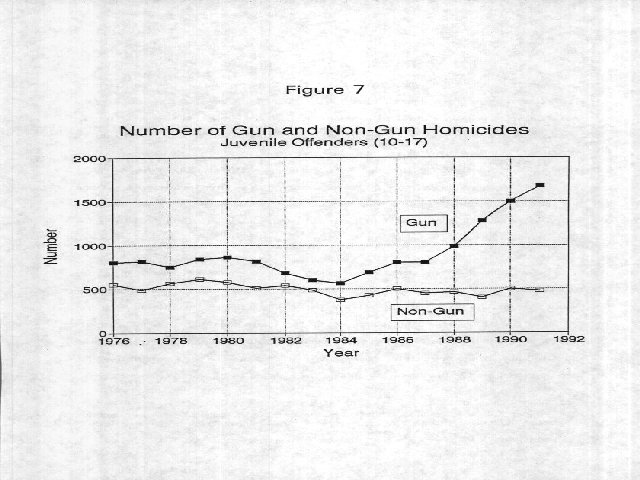
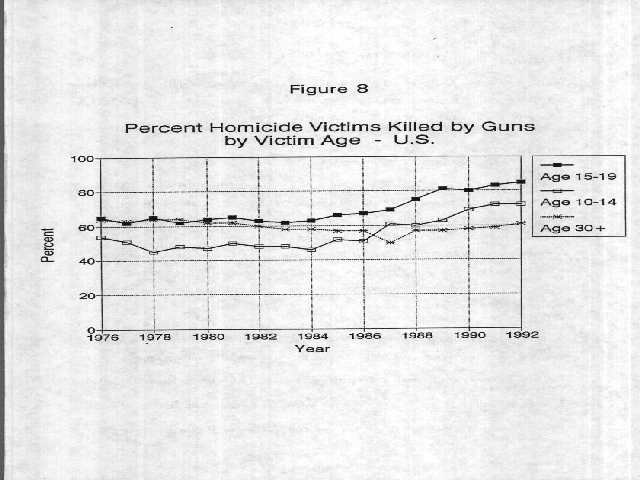
2. Guns Another salient factor intensifying the concern about the homicides is the increasing involvement of guns in young people’s homicides. Again, this can engender fear because of the sense that young people are less likely to exercise the necessary restraint in handling dangerous weapons, and especially so when the weapons are rapid-fire assault weapons. Figure 7’5 presents the number of homicides committed by juveniles (aged 10 to 17) that were committed with a gun or with another means (e.g., knife, strangling, etc.). From 1976 through 1985, a very steady average of 59 percent of the homicides committed by juveniles involved a gun, and the other 41 percent involved some other form of weapon. Beginning in 1985, and especially in 1988, there was a steady growth in the use of guns by juveniles, with no corresponding upward trend (indeed, a continuation of a slight downward trend) in the non-gun homicides. Those changes are also reflected in Figure 8, which shows the difference by victim age (which is also a reflection of perpetrator’s age) in the percent of victims killed by guns. For victims over age 30, the fraction killed by guns has declined a small but statistically significant (t=3.2) average of 0.46 percentage points per year over the 16 years from 1976 through 1991. But for victims in the 15 to 19 age range, that rate has gone from an average 63 percent (with no statistically significant trend) from 1976 through 1984 to a level of 85 percent in 1992 (an average annual increase of 3.0 percentage points from 1984 to 1992). For the younger victims, 10-14, the earlier rate was lower (49 percent, also with no statistically significant trend from 1976 to 1984), but the growth has been even higher, an average annual increase of 3.4 percentage points, to a 1992 level of 72 percent killed by guns.
 |
II. The Drug-Crime Connection Especially in the past decade, an important factor that has affected criminality has been associated with the problem of drug abuse. In a surveyl6 of prisoners conducted in 1991, 32% of prisoners reported using cocaine or crack regularly and 15 % used heroin or opiates regularly. At the time of the offense that led to their imprisonment, 14 % were using cocaine or crack. All these numbers were up appreciably compared to a similar survey that was conducted five years earlier in 1986. These are much higher rates than one finds in general population samples (see the NIDA Household Surveys’7, for example), and so strengthens the importance of a drug connection to crime rates.
 |
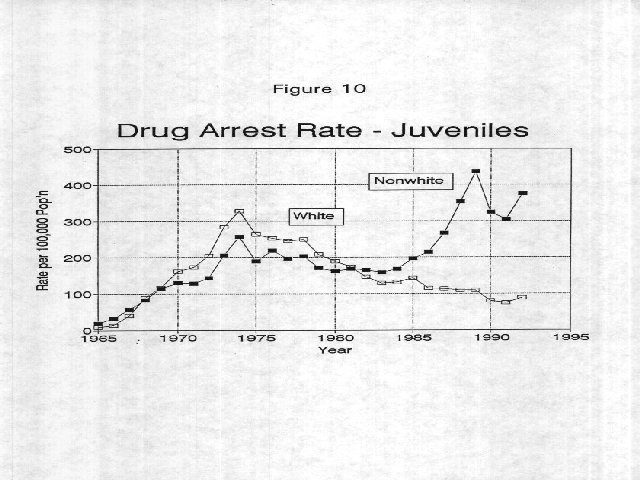
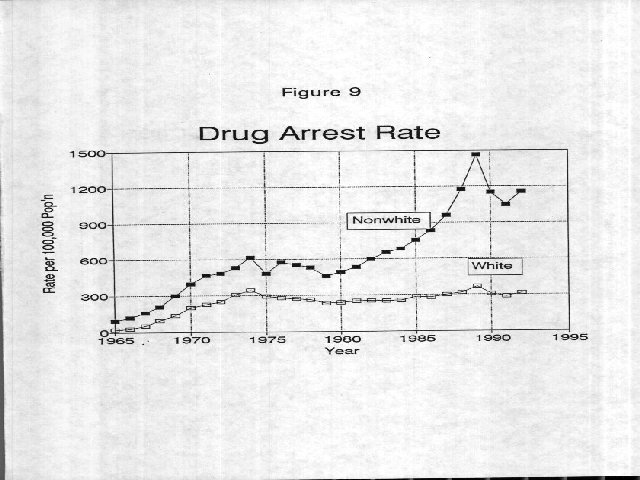
Paul Goldstein’8 has provided a useful taxonomy of the drug-crime connection as being composed of three components other than the sale or possession of the drugs themselves: 1) pharmacological/psychological consequences, where the drug itself causes criminal activity (the most widely recognized connection here is between alcohol and the violence it induces); 2) economic/compulsive crimes, which are crimes committed by drug users to support their habit(the most common connection here is the property crimes committed by heroin addicts who cannot function in the regular economy, and who commit crimes to get the money to buy their drugs); and 3) systemic crime, which includes the crimes committed as part of the regular means of doing business in the drug industry (this would include the violence used as a means of dispute resolution between competing sellers or as retribution between a seller and a buyer as a result of reneging of some form in a drug deal). There is a fourth, still broader connection that should also be considered: the community disorganization effect of the drug industry and its operations on the larger community. This would include the manner by which the norms and behaviors within the drug industry, which can become an important activity within some communities, influences the behavior of others who have no direct connection to the drug industry. This could include, for example, the influence of the widespread prevalence of guns among drug sellers as a stimulus to others in the community to arm themselves similarly, perhaps for self-defense, perhaps to settle their own disputes that have nothing to do with drugs, or perhaps just to gain respectl9. The current drug problem began to emerge in the early 1980s, and then accelerated significantly in the mid-80s. This is reflected in Figure 9, which presents the rate of arrests for drug offenses20, which, especially for nonwhites (primarily African-Americans) started to move upward in the early 1980s, but accelerated appreciably after 1985 with the wide distribution of crack-cocaine, especially in urban ghettos. Because of the concern with juvenile violence, it is particularly interesting to examine the time trends in the drug arrest rate for juveniles, shown in Figure 10. The figure highlights the major initiation of the recruitment of juveniles, primarily nonwhites, into the drug markets beginning with the introduction of crack. Both Figures 9 and 10 also indicate the degree to which the drug war has been focused on non-whites much more that on whites2’. According to police involved in drug enforcement23, this difference is magnified because black drug sellers tend much more often to operate in the street, where they are vulnerable to arrest, whereas white sellers are much more likely to operate indoors. Figure 10 also highlights the degree to which non-white juveniles were recruited into the drug industry beginning in 1985 23. Their amenability to such recruitment was undoubtedly enhanced because of their pessimism - or perhaps even hopelessness - as they weighed their opportunities in the legitimate economy, and the increasing demands for skills in order to gain effective entry.
|
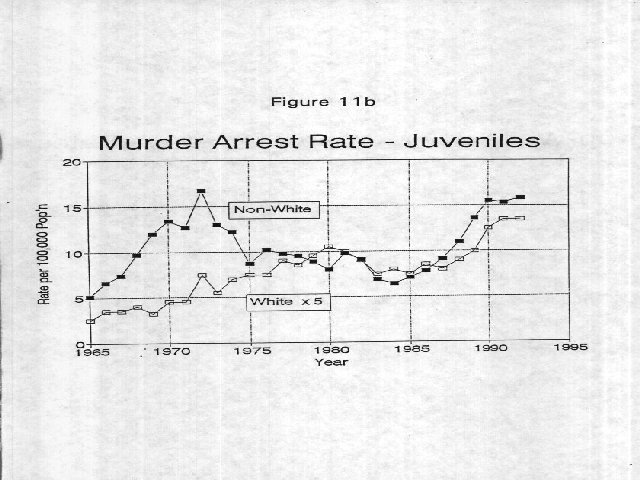
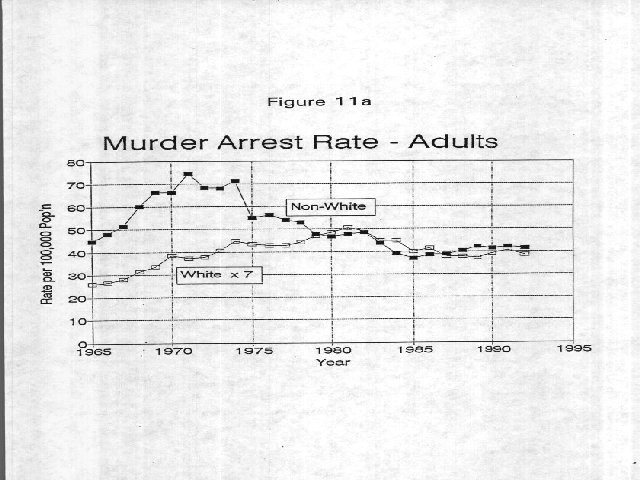
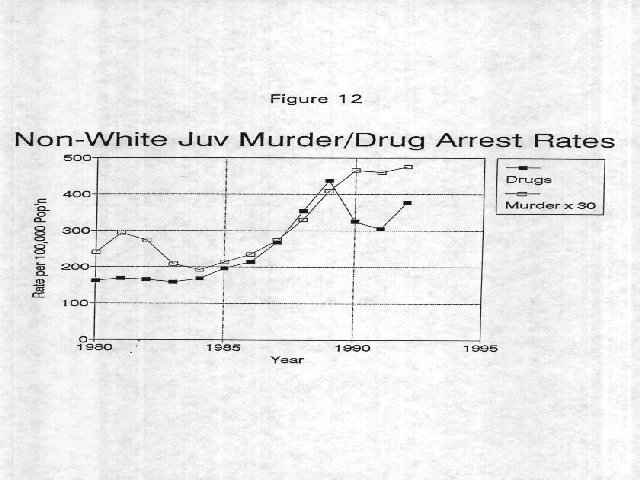
III. A Hypothesized Process In the previous discussion, we have identified three major changes that have occurred in the short period between 1985 and 1992: One explanation for this array of changes involves a process that derives from the nature of illegal drug markets. They recruit juveniles, they arm these recruits with the guns that are standard tools of the trade in drug markets, and then guns and mores on their use diffuse into the larger community. The process starts with the drug industry, which appears to operate in a reasonable equilibrium with the demand for drugs, seemingly so despite the massive efforts over the past decade to attack the supply side. That industry understandably recruits juveniles to work in it, partly because they will work more cheaply than adults, partly because they may be less vulnerable to the punishments imposed by the adult criminal justice system, partly because they tend to be daring and willing to take risks that more mature adults would eschew. The economic plight of many young urban black juveniles, many of whom see no other comparably satisfactory route to economic sustenance, makes them particularly amenable to the lure. These juveniles, as all participants in the illicit drug industry, are very likely to carry guns for self-protection, largely because that industry uses guns as an important instrument for dispute resolution. Also, the participants in the industry are likely to be carrying a considerable amount of valuable product - money or drugs - and are not likely to be able to call on the police if they are robbed. Since a reasonable number of juveniles can be involved in the drug industry in communities where the drug market is active, other teen-agers who go to the same school or who walk the same streets, are also likely to arm themselves, primarily for their own protection, but also because possession of a weapon may become a part of status-seeking in the community. This initiates an escalating process: as more guns appear in the community, that increases the incentive for any single individual to arm himself. Then, in view of the recklessness and bravado that is often characteristic of teen-agers, and their low level of skill in settling dispute other than through the use of physical force, many of the fights that would otherwise have taken place can turn into shootings as a result of the presence of the guns 24. This can be exacerbated by the problems of socialization associated with high levels of poverty, high rates of single-parent households, educational failures, and a widespread sense of economic hopelessness. By the time people reach the more mature ages beyond the early twenties, it appears that they do develop some prudence are more cautious even if they are armed, and display greater restraint. As an alternative possibility, we may be witnessing a cohort effect, and the current 18 year-olds involved in the higher homicide rates may possibly continue their recklessness. That issue still needs to be watched and explored. The validity of these hypothesized processes that are consistent with aggregate national data can be tested with city-level data on drugs, guns, and homicides. That would take advantage of the fact that drug markets flourished at different times in different cities, early in New York and Los Angeles, later in Washington. There is some further evidence that reinforces the possibility of the diffusion of guns from drug markets through the larger community through its juvenile participants. Figures 1 la and llb present the arrest rates for murder for adults and juveniles by race. We see from Figure 1 la that, since 1980, both whites and non-whites have followed the same negative trend (but their rates are in a 7:1 ratio), even though there has been a large difference in their involvement in drug markets (see Figure 9). In contrast, the rates for juveniles - whites and non-whites - has grown markedly since 1985, when the drug arrest rate for non-whites began to climb. The murder arrest rate for non-whites has increased by 123% from 7.1 in 1985 to 15.8 per 100,000 in 1992. The rate for whites has also increased markedly, but by a lesser amount - 80%, from 1.5 to 2.7 per 100,000. The fact that there seems to have been no significant involvement of white juveniles in the drug markets (Figure 10) has not insulated them from the growth in involvement homicide, possibly through the suggested diffusion process. We can also examine the time trends of homicide and drug arrest rates on the same graph, Figure 12. Here, we see that both rates climbed together from 1985 through 1989, but that there was then some decline in the drug arrest rates after 1989. But that decline is not shared by the murder arrest rate. Once the guns are diffused into the community, they are much more difficult to purge.
1) homicide rates by youth 18 and under have more than doubled while there has been no growth in homicide rates by adults 24 and older (Figure 4d),
2) the number of homicides juveniles commit with guns has more than doubled while there has been no change in non-gun homicides (Figure 7), and
3) the arrest rate of non-white juveniles on drug charges has more than doubled, while there has been no growth in the rate for white juveniles (Figure 10).
These changes are sufficiently focused that they have not had major impact on aggregate murder rates (Figure 1). Nevertheless, all of these represent important concerns for the nation, and it is important to try to develop some insights into the processes contributing to these developments.
|
IV Some Policy Speculations
If the speculations about the process underlying the recent growth in youth violence are indeed valid, then they do have some important policy implications, some immediate and some longer-range. One immediate approach would involve aggressive actions to confiscate from juveniles carrying them on the street. Laws permitting that are almost universal, and require more active and skillful enforcement. The need is particularly salient in those communities where the homicide rates have risen dramatically, probably coincident with the location of drug markets. Wilson25 has made some concrete proposals for pursuing such efforts, including a call for improved devices for detecting guns at a distance.
One of the more complex aspects involve the fact that the increase in the juvenile homicide rate is a direct consequence of the operation of drug markets and their criminalization. This does not, of course, warrant an immediate cry for legalization of drugs because any such policy involves a complex weighing of the costs of criminalization (of which homicide is but one) against the probable consequences of greater use of illegal drugs if they were decriminalized. That is a complex issue that cannot be addressed here other than to note that, if the hypothesis is correct, then the "excess murders" discussed earlier represent one component of the cost of the current policy. To the extent that efforts to diminish the size of the illegal market could be pursued, through greater investment in treatment, through more effective prevention, or through finding other means of providing drugs to certified addicts (250,000 of whom are being supported with SSI payments because of their addiction), then the illegal markets would certainly continue, but their demand and volume would probably diminish somewhat. The nation has yet to see a careful assessment of the costs and benefits of the current policies compared to variants that might be considered. Perhaps concern about the "excess murders" we are continuing to experience might contribute to the recognition of its urgency26.
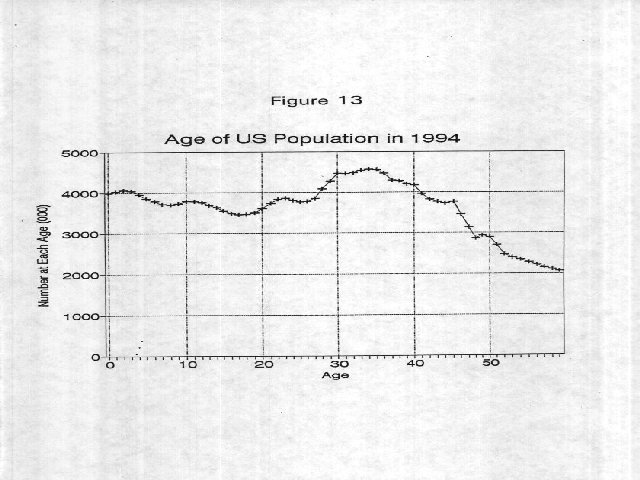
Perhaps more fundamentally there continues to be a critical need to enlist in the legitimate activities of the society the large numbers of people who currently see no role for themselves, and so resist efforts to become socialized into the larger society’s norms. This is not a trivial task, but it is not one to which the society has paid much attention. As one stimulus, it is useful to inspect Figure 13, the age distribution of the US population in 1994. The smallest cohort in the crime-relevant ages is the one that is currently 18, the age with the sharpest increase in age-specific homicide rates (Figure 3). Thus, unless the age-specific rate is decreased, then successive cohorts will be contributing a larger number of murders in the coming years.
|
Notes &References 1 I would like to express my appreciation to Jacqueline Cohen, Daniel Nagin, and Richard Rosenfeld for discussions and suggestions related to this paper. 2 Richard L. Berke, "Crime Joins Economic Issues as Leading Worry, Poll Says, " New York Times, January 23, 1994 reports on a New York Times/CBS poll which asked respondents to identify "the single most important problem facing the country." The leading issue identified by 19% of the respondents was crime or violence, with an additional 2% citing guns. The next largest issue was health care—the subject of considerable public discussion at the time—with 15%. Only 3% cited drug abuse. 3 Note that the murder rate on Figure la is scaled up by a factor of 25 and the burglary rate on Figure lb is scaled down by a factor of ¢ in order to make the patterns over time comparable. 4 The data for Figure 1 are taken from Crime in the United States: Uniform Crime Reports, U. S. Government Printing Office, Washington, DC., published annually by the FBI on the basis of reports by police departments, which, in turn, are based on reports to the police, most often(with the obvious exception of murder) from the victims of the crimes. 5 Seeing this longer-term pattern is much more useful than the simple year-to-year up or down shifts that we are usually offered by the press. The typical journalistic practice of reporting an up-tick on page 1 and a down-tick on a back page undoubtedly contributes to shaping the common perceptions to be ratcheted upward only. 6 See Alfred Blumstein, Jacqueline Cohen, and Harold Miller, "Demographically Disaggregated Projections of Prison Populations," Journal of Criminal Justice 8 (January 1980): 1-26. 7 Arrest is most commonly used as the proxy for offending because the demographic characteristics of offenders are usually unknown, but are easy to establish for arrestees. Studies that have compared victim reports of the demographics of offenders with those of arrestees (for personal crimes like robbery and aggravated assault) find that the two have tended to be closely related. See, for example, Hindelang, Michael, "Race and Involvement in Common Law Personal Crimes," 43 Am. Soc. Rev. (1978). The data on age-specific rates are drawn from the FBI’s Age-Specific Arrest Rates and Race-Specific Arrest Rates for Selected Offenses, 1965- 1992; (Uniform Crime Reporting Program, Washington, D.C.: December 1993). 8 See Blumstein and Cohen, "Characterizing Criminal Careers," Science, 237 (August 1987): 985-991, and Blumstein, Cohen, Roth, and Visher, Criminal Careers and ›Career Criminalst for consideration of the issues involved and estimates of the duration of criminal careers. 9 In Figure 4, for the years prior to 1985, only the five-year points are shown because the rates have been reasonably stable. Annual rates are shown for each of the years 1985 through 1992 because they display much more significant change. 10 We define the "excess murders" as those attributable to the increase in the murder arrest rate above the mean rate for each age that prevailed over the 1970-1985 period. The rates are based on arrests rather than on murders committed, but since the number of murder arrests in a year is generally roughly equal to the number of murders reported, we make the calculation by assuming one murder per arrest. Since some murders lead to multiple arrestees (and some murderers commit multiple murders), this is an approximation, but not an unreasonable one. 11 Uniform Crime Reports, l991, op. cit. l2 The data for Figure 5 were generated by Glenn Pierce and James Fox from the FBI’s Supplementary Homicide Reports, based on reports by police departments on individual homicides. 13Based on data from the National Center for Health Statistics provided by James Mercy and Kenneth Powell of the Center for Disease Control and Prevention. 14 These estimates and the data for Figure 8 were prepared by Jacqueline Cohen from data reported in the FBI’s annual Uniform Crime Reports, based on Supplementary Homicide Reports submitted by police departments. 15 Figure 7 is based on data from a figure in James Fox, "Teenage Males are Committing Murder at an Increasing Rate", a report prepared for the National Center for Juvenile Justice, April, 1993, based on date from the FBI’s Supplementary Homicide Reports, a compilation of detailed reports on individual homicides provided by police departments. 16 Survey of State Prison Inmates, 1991; Bureau of Justice Statistics Report No. NCJ-136949, March 1993, p.21 17 National Institute on Drug Abuse, National Household Survey of Drug Abuse, published periodically. Washington, D.C.: USGPO. 18 Paul J. Goldstein (1985) "The Drug/Violence Nexus: A Tripartite Conceptual Framework," Journal of Drug Issues 15: 493-506. l9 Elijah Anderson, in "The Code of the Streets" Atlantic Monthly 273 (May 1994): 80-94, highlights the importance of gaining respect as an important motivating factor in individual behavior in urban ghettos. In a survey of juveniles incarcerated for serious crimes and of students in center-city high schools, it was found that 22% of the students possess guns, 12% carry them most of the time, and another 23 % carry guns "now and then. " The inmates and the students offered similar reasons for carrying guns: 70% of the inmates and 68% of the students cited protection as the main reason for their most recent gun acquisition. See J.F. Sheley and J.D. Wright (1993) Gun Acquisition and Possession in Selected Juvenile Samples, Research in Brief, (Washington, D.C.: U.S. Department of Justice, National Institute of Justice). 20 Arrests for drug offense obviously confound information on the presence of drug-market activity with the aggressiveness of police in pursuit of drug offenders. Richard Rosenfeld, Eric Baumer, and Scott Decker, "Multiple Indicators of Illicit Drug Use: Comparisons Between Law Enforcement and Health Data Systems," Paper presented at DUF Directors’ Meeting, July 11, 1994, Washington, D.C., have shown in cross-city analyses that drug arrests is the best predictor of other indicators of drug activity, including the percent of drug-positives in urinalysis of booked arrestees (DUF) and admissions to emergency rooms with drug-related problems (DAWN). 2l One would hope that would be a reflection of differential involvement in drug marketing, but that does not necessarily appear to be the case. In a household survey conducted by the National Institute of Drug Abuse (NIDA), blacks represented 19% of those who reported having sold drugs in the last 12 months, but they represented 6496 of the sellers who reporting having been arrested for selling drugs (Jonathan P. Caulkins and Daniel McCaffrey, "Drug Sellers in the Household Population, November 11, 1993. Santa Monica: Rand Corp., based on data from National Institute of Drug Abuse, 1991. National Household Survey on Drug Abuse: Population Estimates, 1991. DHHS Publication No. (ADM)92-1887. Washington, D.C.: USGPO. But these results are complicated by the many problems with self-report data, non-respondents, and evidence that blacks are more likely than whites to under-report their involvement in criminal activity. (See Michael Hindelang, Travis Hirschi, and Joseph Weis, Measuring Delinquency, Beverly Hills, CA: Sage, 1981). 22 Personal communication. 23 It is interesting to note from Figure 10 that, in 1975, a policy shift reversed the then rapidly growing drug arrest rate (primarily for marijuana offenses) of whites, whose arrest rate for drugs exceeded that of non-whites throughout the 1970s. 24 Joel Tarr has called my attention to a passage in Jane Addams’ The Spirit of Youth and the City Streets, (Urbana: University of Illinois Press, 1972) in which some 13-year-old boys were taunting each other, and one of them goes into the house to get a gun and shoots the taunter through the head and kills him. Ms. Addams notes that "This tale could be duplicated almost every morning; what might be merely a boyish scrap is turned into a tragedy because some boy has a revolver." The original edition was published in 1909. 25 James Q. Wilson, "Just Take Away the Guns", New York 7Tmes Magazine Section, March 20, 1994. 26 This is a call made recently by Surgeon General Joycelyn Elders that was ignored as a result of the aggressive political response. It is an assessment I suggested in my Presidential Address to the American Society of Criminology in November, 1992, to be carried out by a Presidential Commission with major research support from the National Academy of Sciences. (See Alfred Blumstein, "Making Rationality Relevant," Criminology 30: 1-16).


